VMWare-VM-Performances-List
Description
This report displays statistics of the vCPU, memory and IOPS usage on the virtual machines.
The report is optimized for an xlsx generation in order to create the needed order by and filters.
How to interpret the report?
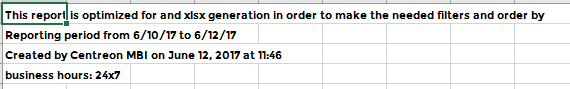
The first tab displays information on the reporting period, the live service perdio selected and the generation report date.
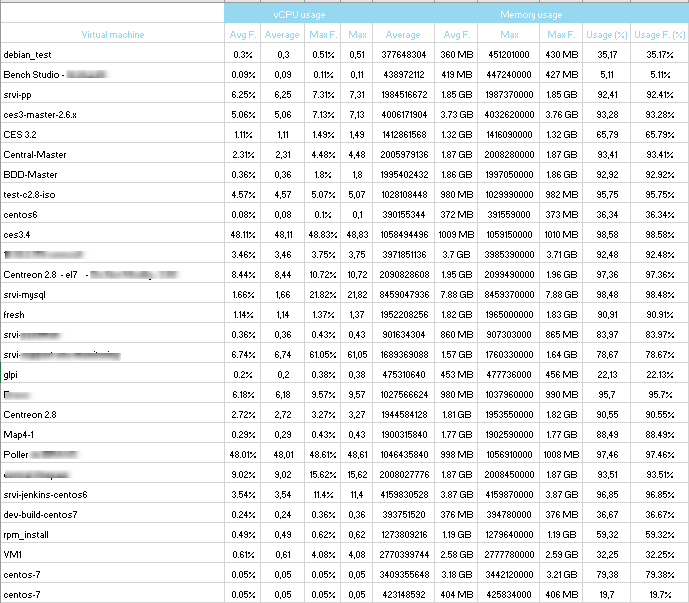
The second tab displays the virtual machines list with the vCPU usage (average, average formated, max, max formated) and the memory usage (average, average formated, max, max formated, percent usage, percent usage formated)
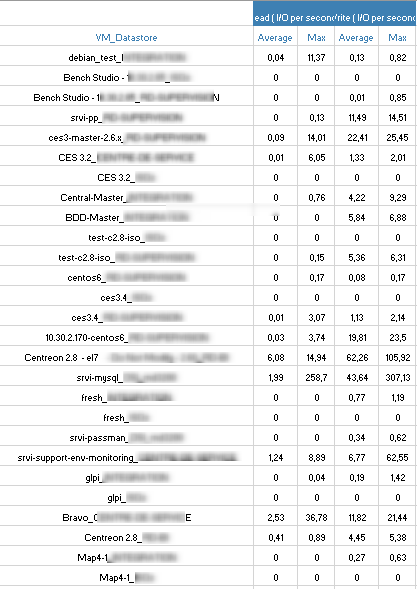
The last tab displays the virtual machines by datastore and their read / write IOPS usage displaying the average and the maximum reached.
Parameters
Parameters needed by the report are:
The reporting period.
The following Centreon objects :
Parameters |
Type |
Description |
|---|---|---|
Time period |
Dropdown list |
The reporting live service to use |
Host to report |
Dropdown list |
Select the VCenter to report on |
Host category |
Multi selection |
Host category to filter on |
Service category |
Multi selection |
Select the service category containing the global VM statistics |
Prerequisites
This report is developped for a full compatibility with the plugin pack Virt-VMware2-ESX and Centreon-VMWare-2.0 connector. The prerequisites for the proper functioning of the report are:
The monitoring of the following indicators:
Un service Vm-Cpu-Global.
Un service Vm-Memory-Global.
Un service Vm-Datastore-Iops-Global.
The creation of the following service category:
VM-Statistics: containing the indicators Vm-Cpu-Global, Vm-Memory-Global and Vm-Datastore-Iops-Global.