Host-Detail-3
Description
Goal: The report gives detail statistics on availability, alarms, storage usage, memory, CPU and traffic, for a equipment.
How to interpret the report?
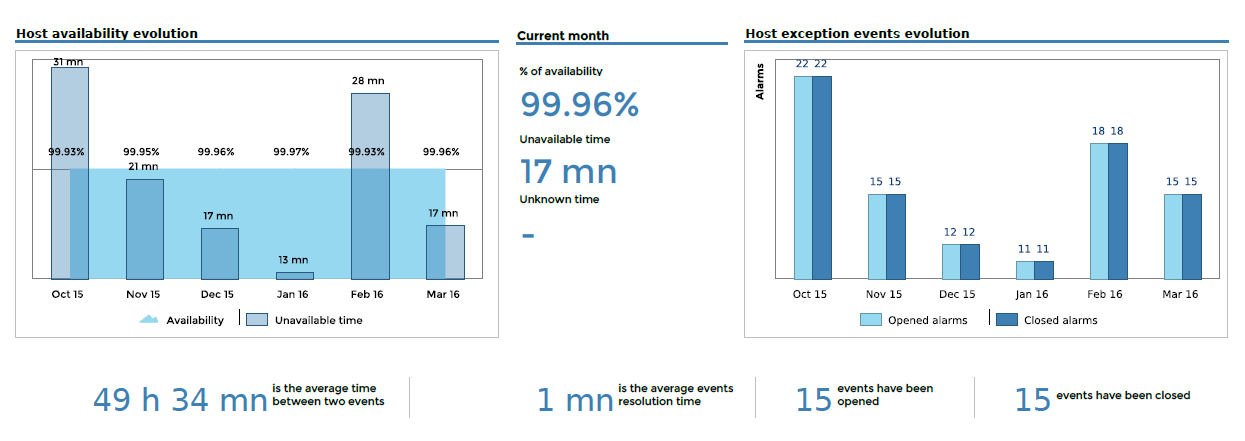
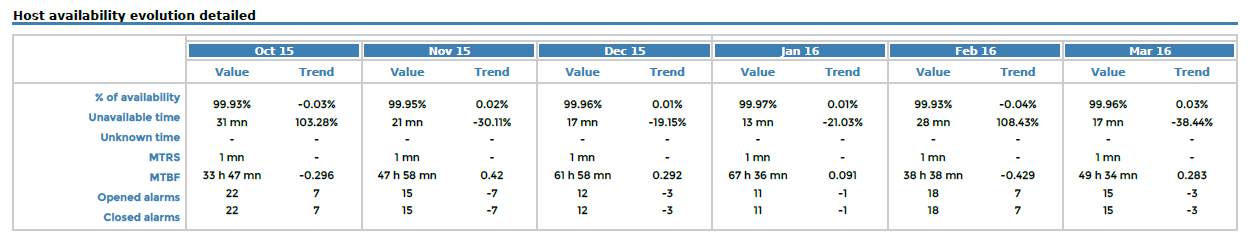
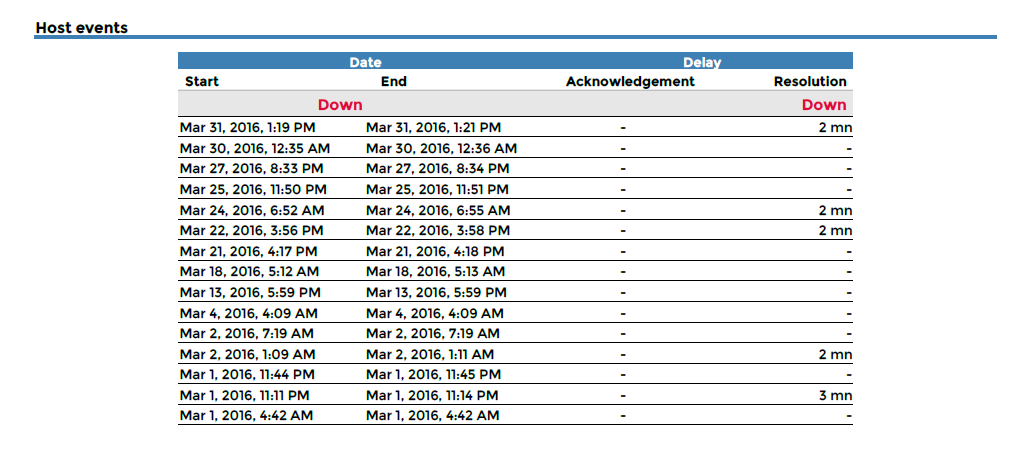
The first page diplays detailed statistics on the equipment’s availability.
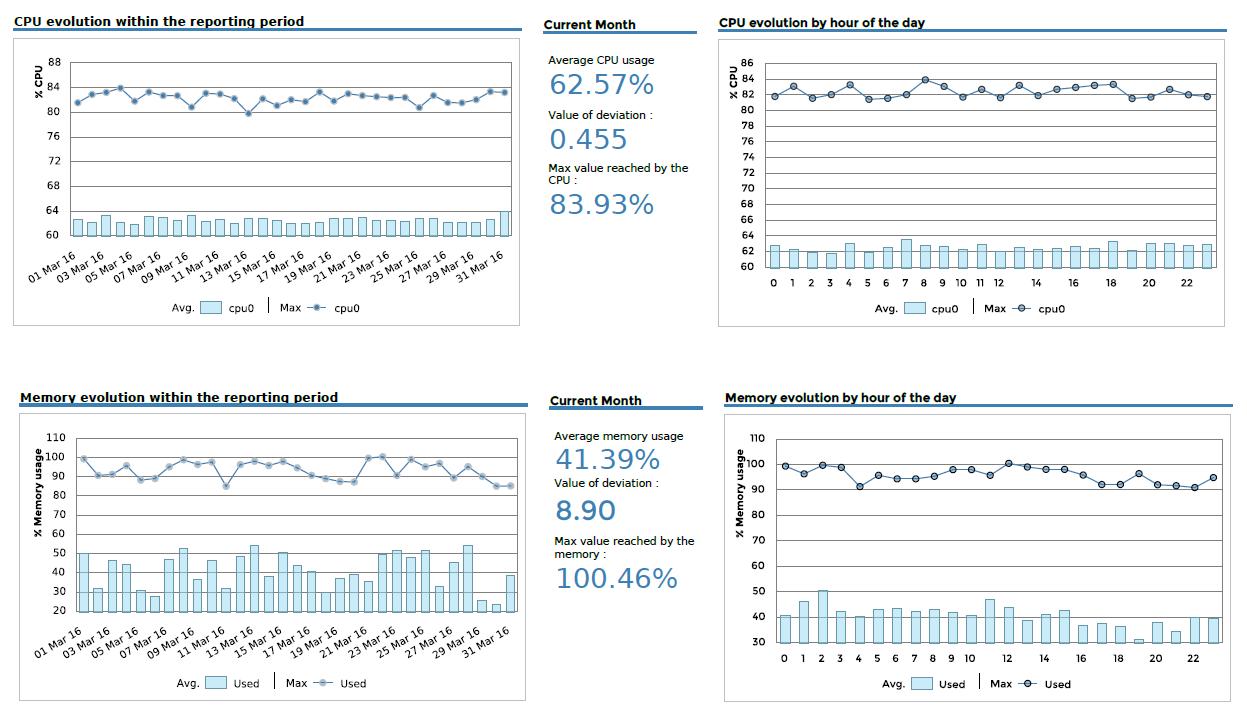
The second page diplay detailed statistics on the equipment’s performances ( CPU and Memory)
On the third page, Storage capacity is detailed by services and services categories..
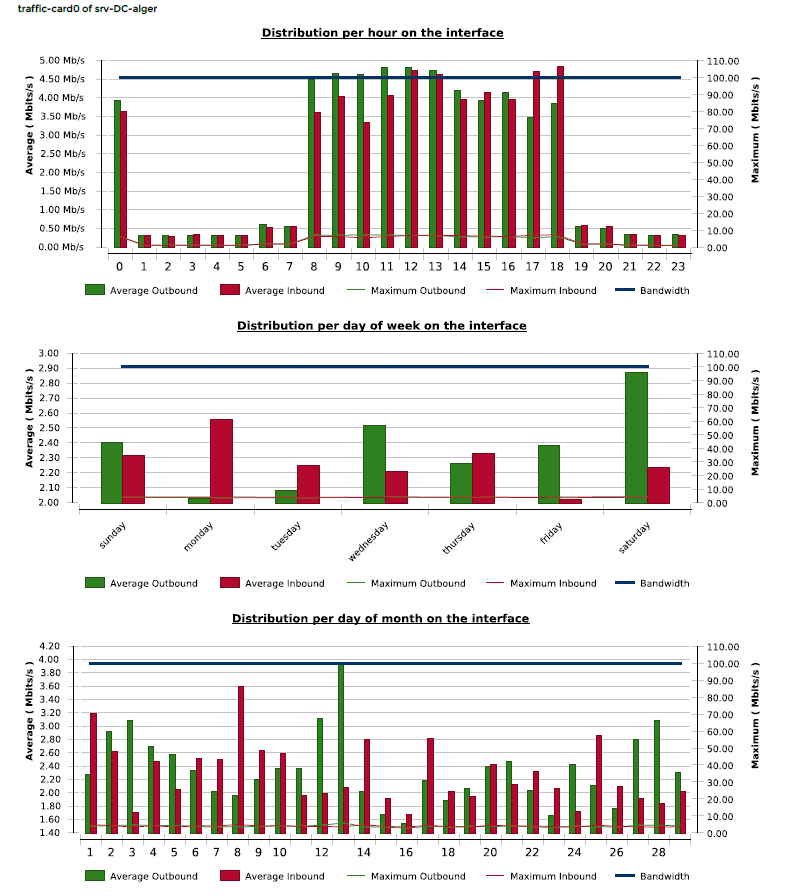
On the fourth page, Inbound and outbound traffic répartition is detailed for hourly, weekly and daily granuality for each interface found.
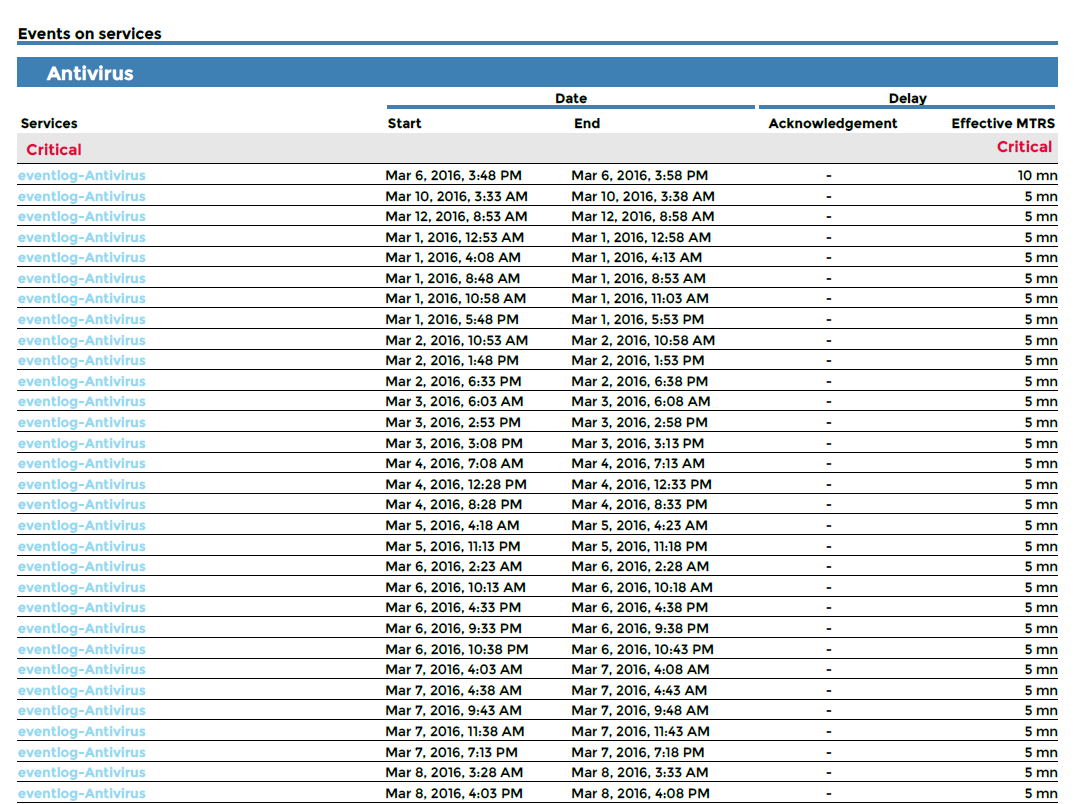
Finally, an annexe which diplays a detailed reporting on alarms.
Second page
Third page
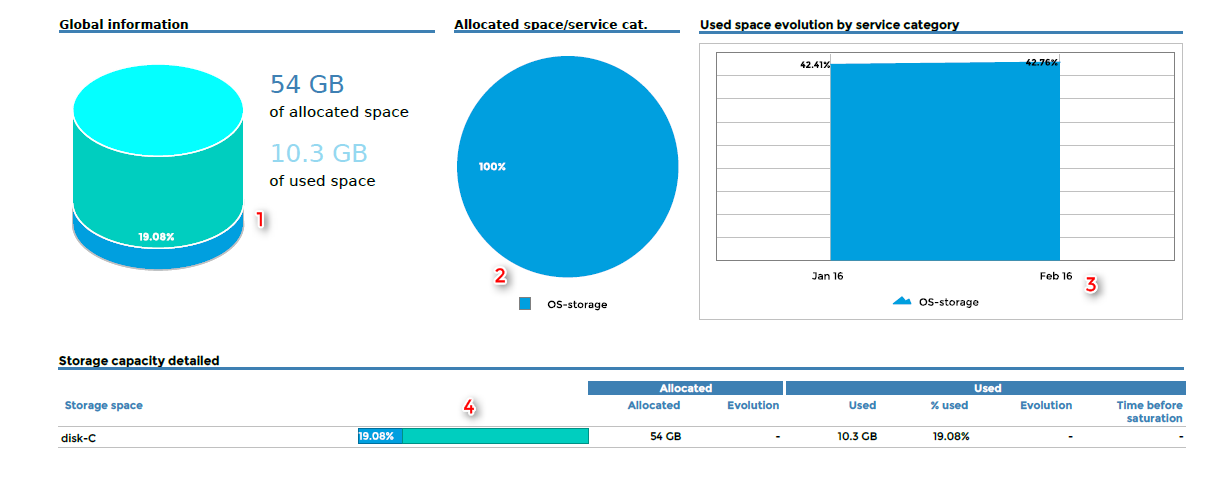
1 - Storage statistics at the last day of the reporting period
2 - Storage statistics at the last day of the reporting period
3 - Storage statistics at the last day of each month
4 - Storage statistics at the last day of the reporting period versus the last day of the previous period
Fourth page
Parameters
Parameters needed by report are:
The reporting period
The following Centreon object:
Parameter |
Parameter type |
Description |
|---|---|---|
Time period |
Dropdown list |
Time period to use |
Interval |
Text field |
Number of month to display in evolution graphs |
Host |
Dropdown list |
Host selection |
CPU service category |
Dropdown list |
Service category containing CPU service(s) |
CPU metric(s) |
Multi Select |
Select metric(s) to use for CPU statistics |
Storage service category |
Multi Select |
Storage service categories containing the storage service(s) |
Storage Metric(s) |
Multi Select |
Metric to exclude from the storage statistics |
Memory service category |
Dropdown list |
Service category containing memory service(s) |
Memory metric(s) |
Multi select |
Select metric(s) to use for memory statistics |
Traffic service category |
Multi sélection |
Service category containing traffic service(s) |
Traffic In metric |
Dropdown list |
Inbound traffic metric to select |
Traffic out metric |
Dropdown list |
Outbound traffic metric to select |
Prerequisites
To ensure consistency in graphs and statistics, some prerequisites are necessary regarding to performance data returned by plugins.
Performance data are data returned by a plugin after the “pipe” - “|” - , these data have to be returned as follow:
output-plugin | metric1=valueunit;warning_treshold;critical_treshold;minimum;maximum metric2=value ....
It is important to make sure that plugins return the maximum value because lot of statistics are based on percentage, calculated using this maximum value. Be sure that the storage plugins, memory plugin and traffic plugins return this maximum value. The unit must be Bytes for storage and memory plugins, un Kb/s for traffic plugins..
Warning
This report is compatible with the timeperiod 24x7 only. This timeperiod have to be configured on the menu “General options | Capacity statistic agregated by month | Live services for capacity statistics calculation”