Poller-Performances
Description
This report displays information about the configuration and performances of Centreon Engine on a Poller.
How to interpret this report?
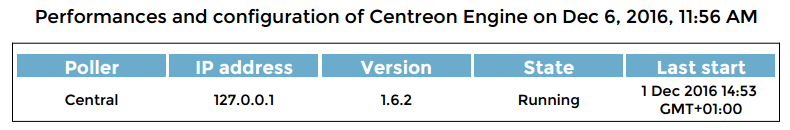
The Poller name, the IP address, the version and the state of the engine, and the date of the last restart are displayed on the first part of the report.
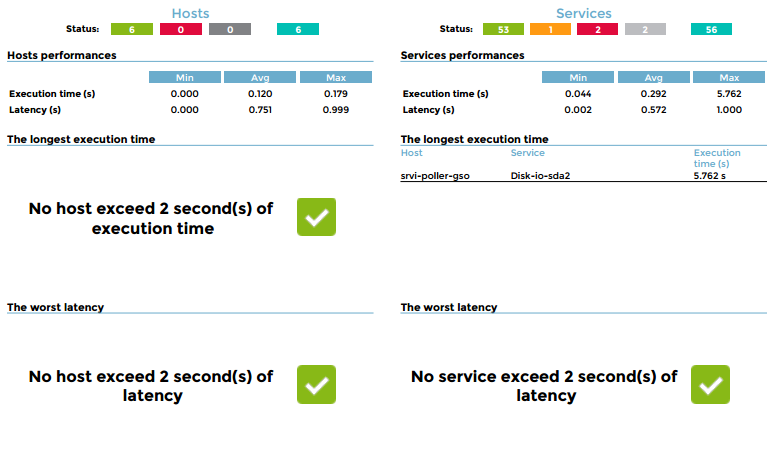
Then, states of hosts and services monitored by the poller are displayed.
Statistics about latencies and execution times are represented. Hosts and services exceeding tolerated thresholds are displayed.
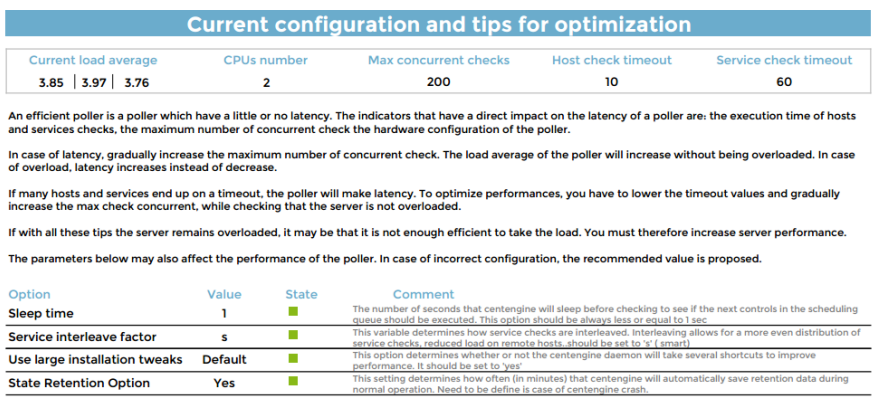
Finally, the current configuration of Centreon Engine and tips to optimize it in case of performance issues
Parameters
Data represented on the report are the real time data.
Parameters needed by the report are:
The following Centreon objects :
Parameter |
Type |
Description |
|---|---|---|
Select poller(s) on which you want to the report |
Radio bouton |
Generate the report on the Central poller, the remote pollers, or all pollers |
Limit latency (sec) |
Text field |
Latency threshold. Equipments / services exceeding the threshold are listed |
Limit exceution time (sec) |
Text field |
Execution time threshold. Equipments / services exceeding the threshold are listed |
Prerequisites
The prerequisites for this report are:
Monitoring of the load average on the pollers ( metric names should be: load1, load5 and load15)
Monitoring of the CPU on the poller ( metric names should contain cpu string with the core number. Example: for a 4 core CPU, metrics can be cpu0,cpu1,…or cpu_0,cpu_1,…