Hostgroups-Availability-1
Description:
Goal: This report shows availability, events exception distribution on multiple hostgroups. It shows also the evolution of equipments on each hosts group, the evolution of availability and excention events number, and the critical equipments and indicators.
How to interpret the report?
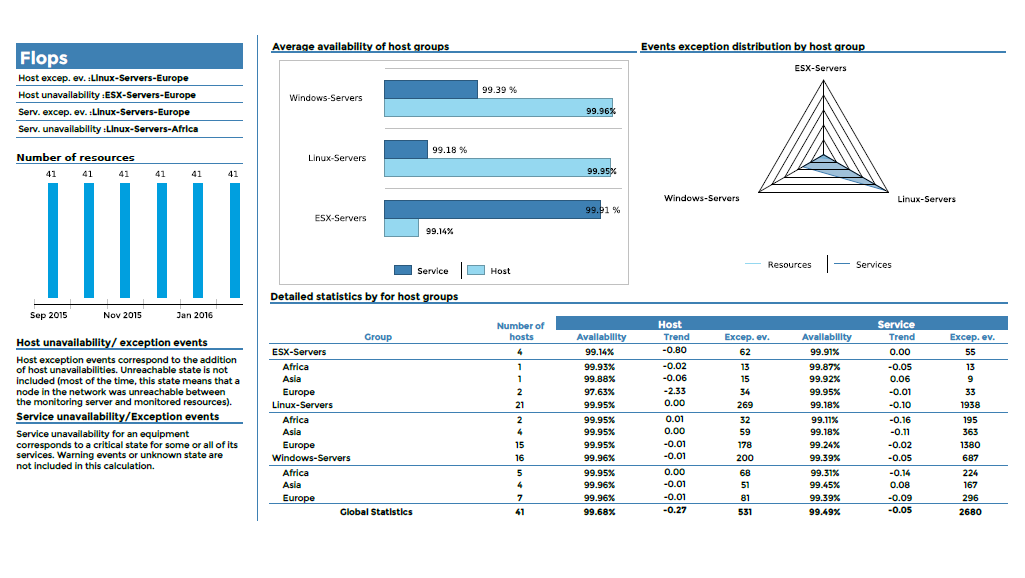
On the first page, the report displays graphs of the hosts and indicatros availabality on hostgroups, the exception events distrution, the ressource number evolution, and a cross table which detailed all statisctics of all previous informations.
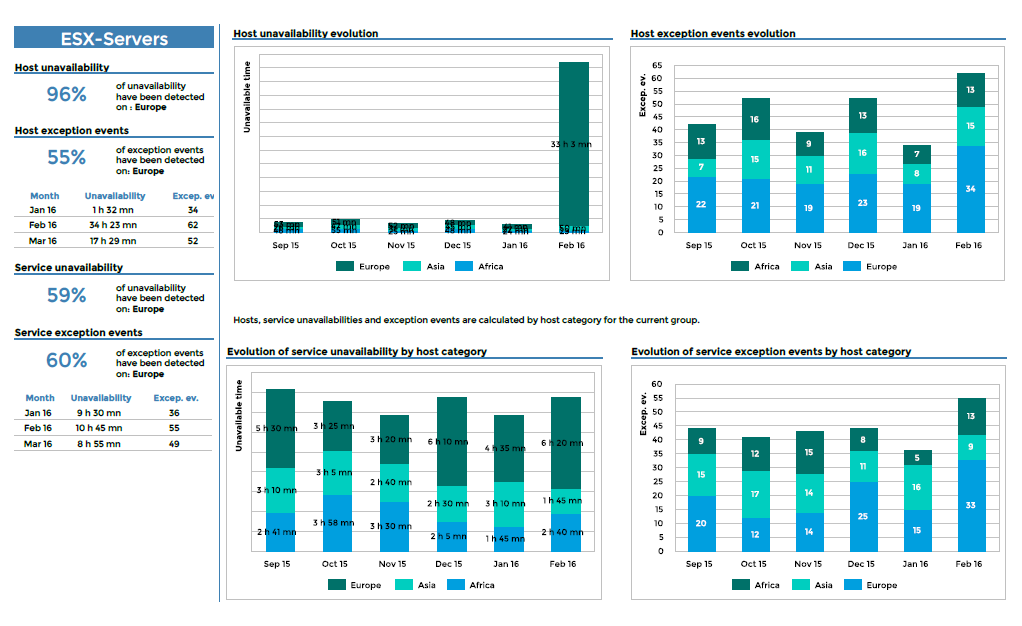
In the following pages, the unavailability and exception events evolution are detailed for each host group, sorted by host categories and services categories.
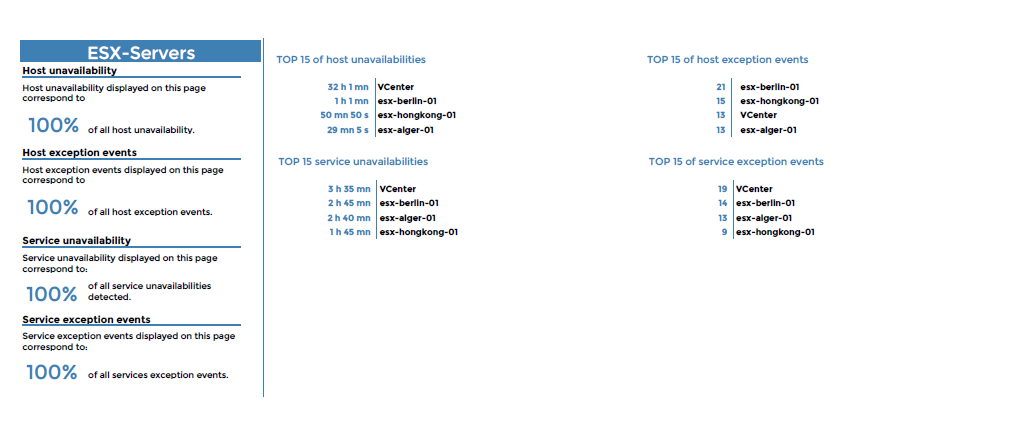
Finally, hosts and services tops are displayed: tops of hosts that had the most unavailable time and exception events are displayed and tops on hosts that had the most service unavailable time and indicators exception events.
First page
Parameters:
Parameters needed by the report are :
The reporting period
The following Centreon objects :
Parameter |
Parameter type |
|
|---|---|---|
Hostgroups |
Multi selection |
Hostgroups to use |
Host Categories |
Multi selection |
Host Categories to use |
Service Categories |
Multi selection |
Service Categories to use |
Time period |
Dropdown list |
Time period to use |
Interval |
Text field |
Number of month to show in trend graphs |