Hostgroup-Storage-Capacity-List
Description
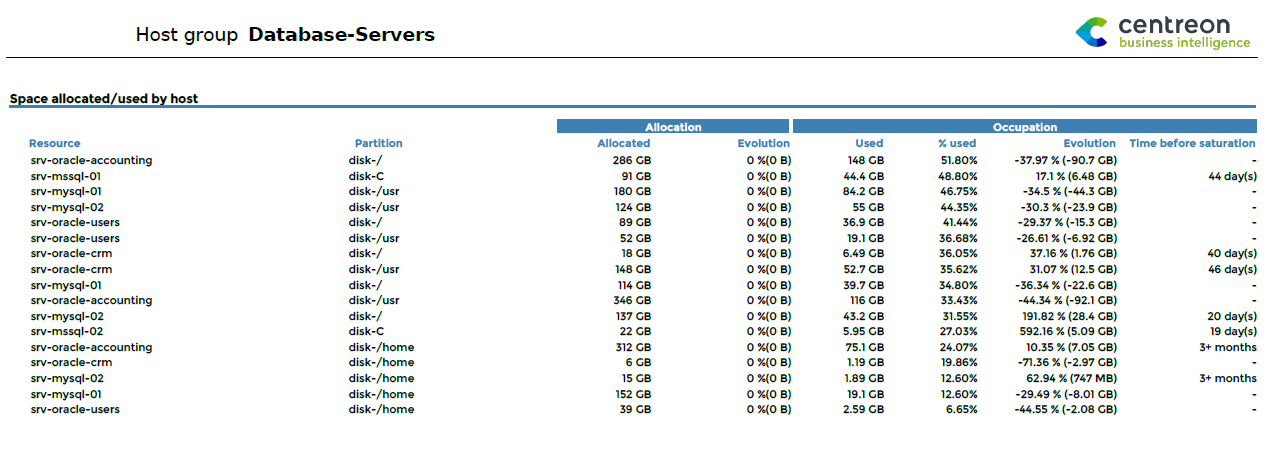
Goal: This report displays the list of storage spaces usage for a hostgroup.
How to interpret the report?
The report lists in a table all partitions available on hostgroup’s ressources used as parameter. For each partition, detailed information about the allocated and the used space , the evolution relative to the last month, and previsions on time before saturation.
Note
Statistics displayed in evolution tables and graphs by months correspond to values of indicators measured the last day of concerned months. « Snapshot » statistics ( versus evolution statistics by month ) correspond to values of indicators measured the last day of the reporting period. When an evolution calculation is done, it is calculated comparing values of indicators the last day of the reporting period and the values of indicators the day before the first day of the reporting period.
Parameters
Parameters needed are
The reporting period
The following Centreon objects:
Parameter |
Parameter type |
Description |
|---|---|---|
Hostgroup |
Dropdown list |
Hostgroup to use |
Host categories |
Multi select |
Host categories to use |
Service categories |
Mutli select |
Service categories to use |
Metrics |
Mutli select |
Metric to exclude from the list |
Time period |
Dropdown list |
Time period to use. /!Only the timeperiod 24x7 should be used /! |
Prerequisite
To ensure consistency in graphs and statistics, some prerequisites are necessary regarding to performance data returned by plugins.
Performance data are data returned by a plugin after the “pipe” - “|” , these data have to be returned as follow:
output-plugin | metric1=valueunit;warning_treshold;critical_treshold;minimum;maximum metric2=value. . .
It is important to make sure that plugins return the maximum value because lot of statistics are based on percentage, calculated using this maximum value. Be sure that the storage plugins and memory plugin return this maximum value. The unit must be Bytes.