Hostgroups-Incidents-1
Description
Goal:
This report gives you an overview of host exception events and unavailability
How to interpret the report?
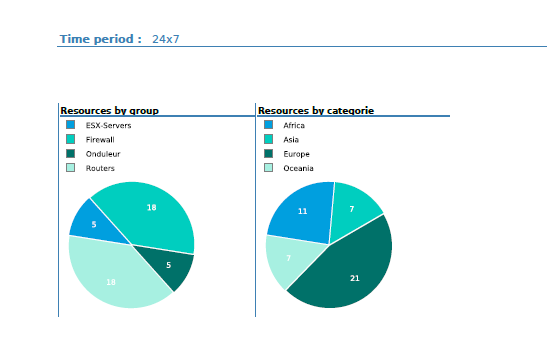
On the first page, two graphs give the number of hosts by host groups and host categories
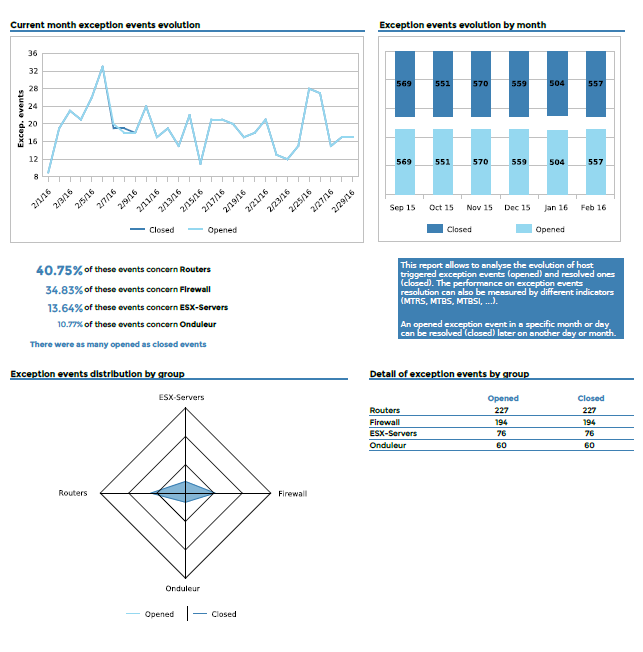
Then, graphs that displayed exception events evolution on the reporting month by day, and on the previous months.
A radar graph shows the exception events distribution by Hostgroups.
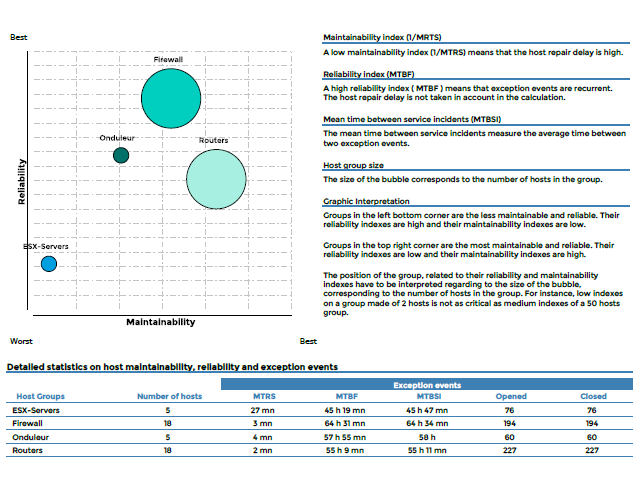
The graph below-against shows the groups maintainability and reliability, determined using an index based on MTRS and MTBF times.
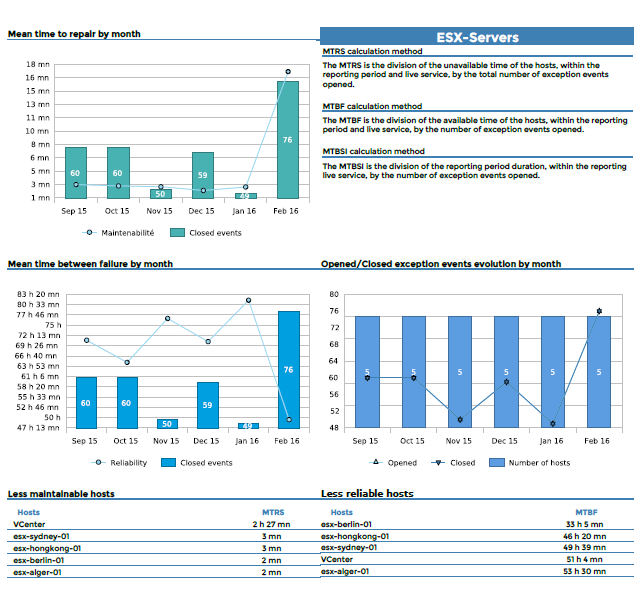
A detail by host group is shown below. It gives the exception events evolution by equipments. And finally, a TOP of equipments the less maintained and less reliable displayed for each host group.
Cover page
First page
Second page
For each host group
Parameters
Parameters needed by the report are :
The reporting period.
The following Centreon objects :
Parameter |
Parameter type |
Description |
|---|---|---|
Hostgroups |
Multi selection |
Hostgroups to use |
Host Categories |
Multi selection |
Host Categories to use |
Live service |
Dropdown list |
Time period to use |
Trend graphs |
Text field |
Number of month to show in trend graphs |