VMWare-Cluster-Performances-1
Description
This report diplays the CPU and memory performances on an ESX cluster. Virtual machines hosting on ESXs and datastores usage on the cluster.
How to interpret the report?
For a given ESX cluster input, and a reporting period, the report displays:
On the page 1:
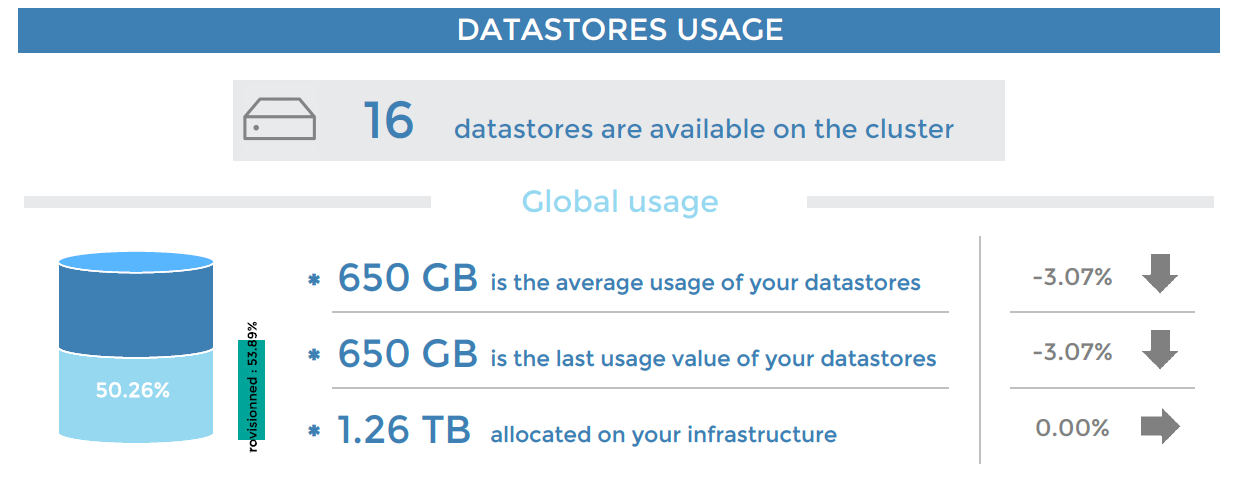
The total nomber of datastores available on the cluster. The average space usage on all datastores of the cluster, in percent and bytes. The last usage value on the selected period. The allocated space on all datastores of the cluster. For the three last informations, an evolution from the previous period is displayed.
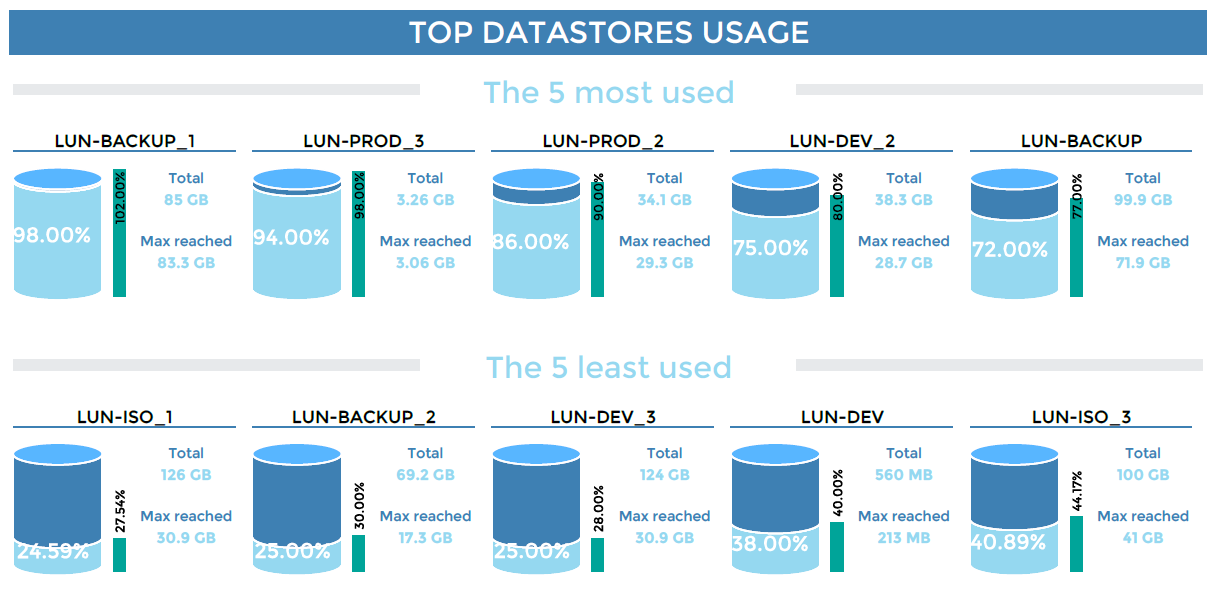
Then, a Top 5 and a bottom 5 of datastores usage are highlighted, displaying for each datastore, the usage percent, the max value reached and theallocated space.
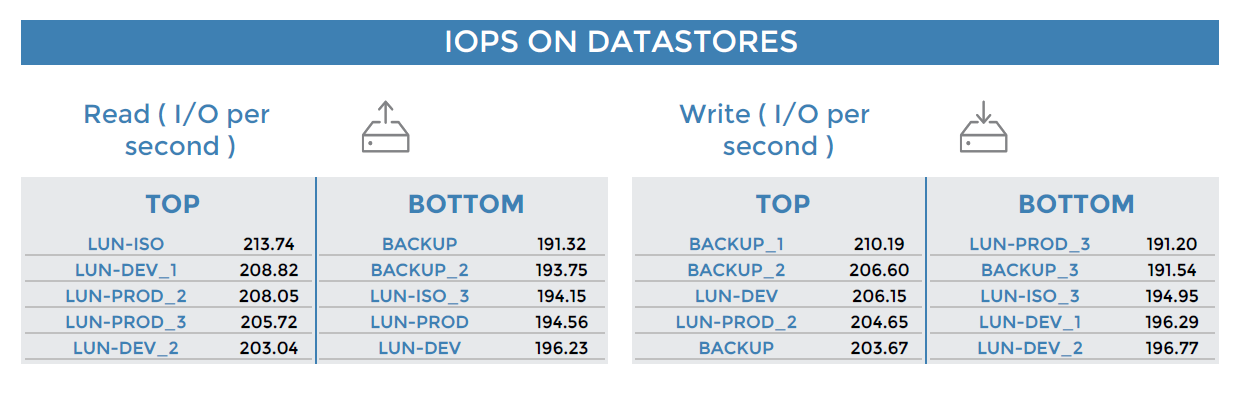
Finally, a top 5 and bottom 5 for ESX generating read and write IOPS (input/output per second).
On the page 2:
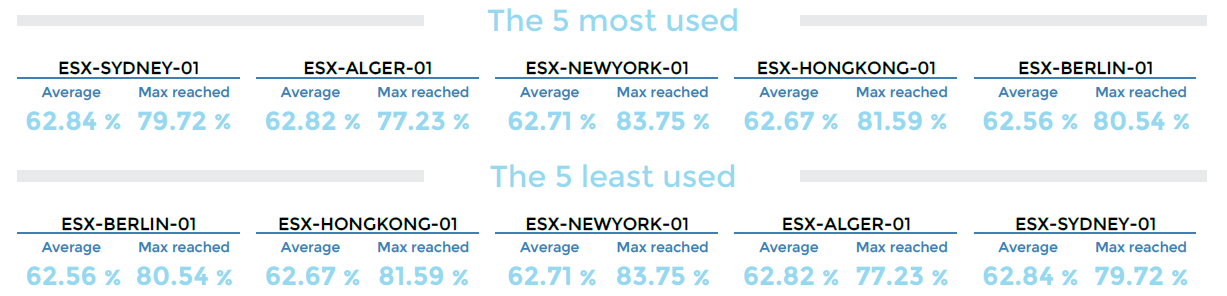
The average CPU consummation on all ESX’s cluster, and the evolution from the previous period is displayed.

The ESXs using the most and the least CPU are highlighted, displaying for each ESXs, the average consummation and the max value reached.
then, the average memory usage on all ESX’s cluster and the total memory alocated are displayed:
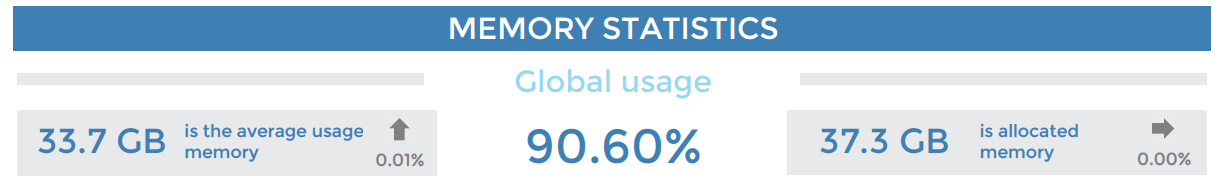
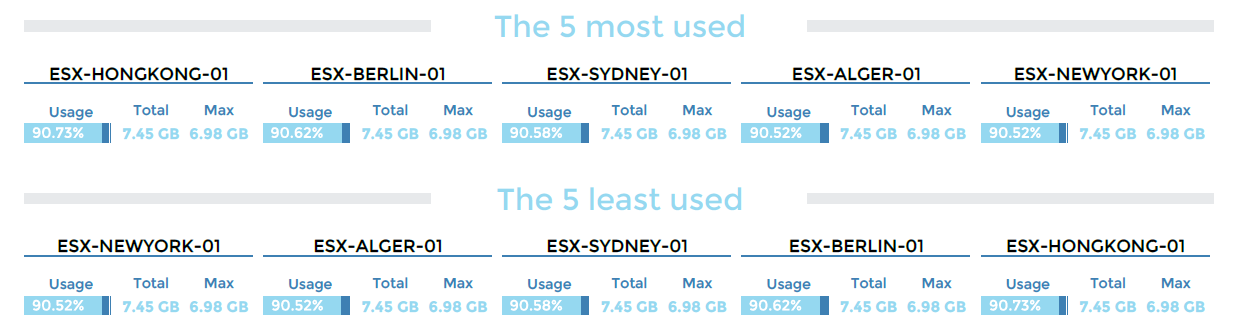
A highlighted of ESXs using the most and the least memory, displaying for each ESX, the average usage on the period, the total memory available and the max value reached.
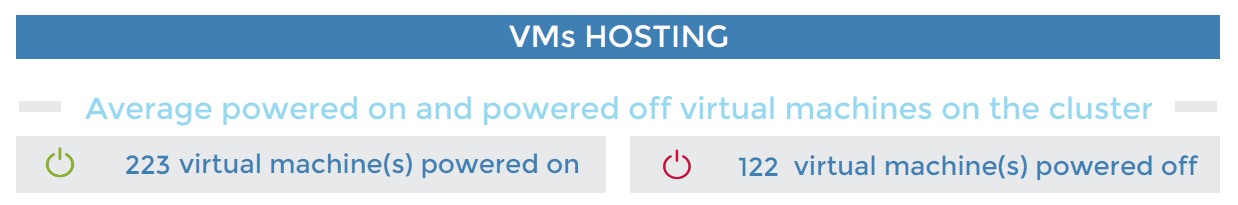
Finally, information about powered on and powered off virtual machines on the cluster.
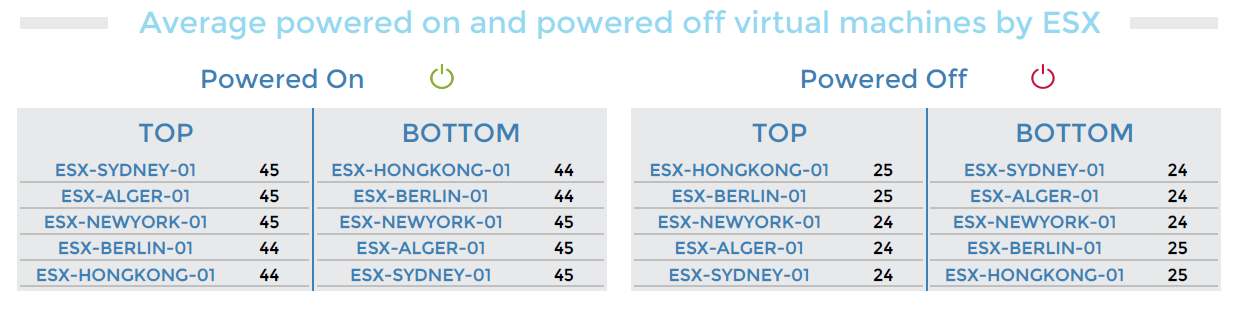
with a highlight of ESXs hsoting the most and the least virtual machines powered on and powered off:
Parameters
Parameters needed by the report are:
The reporting period.
The following Centreon objects :
Parameter |
Type |
Description |
|---|---|---|
Time period |
Dropdown list |
Time period to use |
Host group |
Dropdown list |
Cluster selection |
Host category |
Multi selection |
Host categories containing cluster’s host to filter on |
Datastore Service category |
Multi selection |
Service categories containing the datastore usage |
IOPs Service category |
Multi selection |
Service categories containing the IOPS |
CPU Service category |
Multi selection |
Service categories containing the ESX’s CPU usage |
Memory Service category |
Multi selection |
Service categories containing the ESX’s Memory usage |
VM count Service category |
Multi selection |
Service categories containing the VM count services on ESXs |
Datastore usage (filter) |
Text field |
Type the common part to be filter and replace (% to keep all) |
Datastore iops (filter) |
Text field |
Type the common part to be filter and replace (% to keep all) |
Prerequisites
This report is developped for a full compatibility with the plugin pack Virt-VMware2-ESX and Centreon-VMWare-2.0 connector. The prerequisites for the proper functioning of the report are:
The monitoring of the following indicators:
a CPU service, a Memory service and a VMCount service for each ESX.
a Datastore-usage service for each datastore or for all datastores, linked to the VCenter or to only one ESX of the cluster. By default, the service will have the following nomenclature: Datastore-Usage-xxxx (xxxx is the datastore name).
a Datastore-iops service for each datastore or for all datastores, linked to the VCenter or to only on ESX of the cluster. By default, the service will have the following nomenclature: Datastore-Iops-xxxx (xxxx is the datastore name).
The creation of hostgroups corresponding to clusters, a cluster (hostgroup) contains:
Several ESXs ( hosts)
the VCenter, only if Datastore-usage and Datastore-IOPS services are linked to the VCenter and not to one cluster’s ESX.
The creation of a at least one host category containing the whole cluster (vCenter + ESXs). If you have multiple ESX clusters, use the hostcategory dimension to split them and filter them.
The creation of the following service categories:
CPU-ESX: containing all the ESX’s CPU usage..
Memory-ESX : containing all the ESX’s Memory usage.
VMcount-ESX: containing all the VMcount check on ESXs.
Datastore-usage: containing all Datastores-usage indicators.
Datastore-IOPS : containing all Datastore-IOPS indicators.
Note
If a datstore or an ESX host contains more than 16 characters, only the first 16 will be shown, and supplemented by 3 points.