Hostgroups-Host-Current-Events
Description
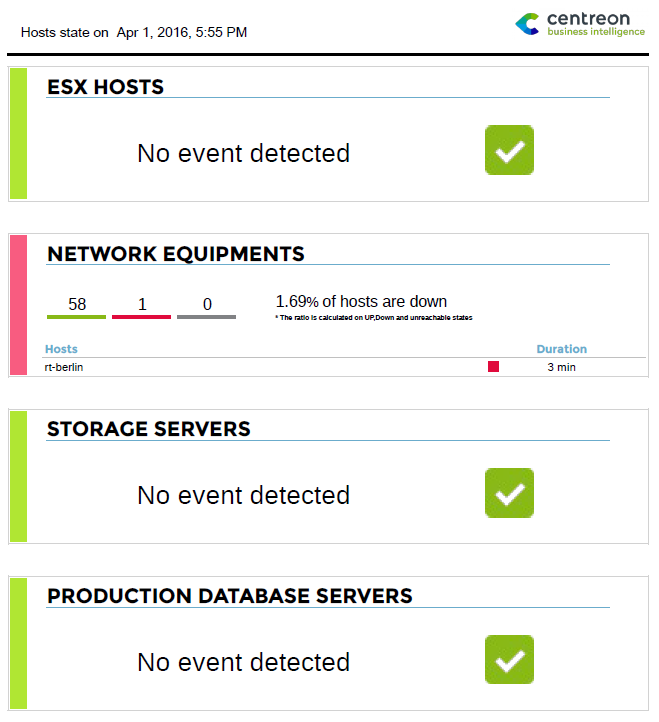
This report display current events on hosts at its generation.
How to interpret the report?
The report contains four parts. On each part, it’s possible to select a restricted perimeter by using filters on hsotgroups and hostcategories. Displayed data are realtime results.
Events can be sorted by state, duration or hostname.
It’s possible de display / filter acknowledged hosts or hosts in downtime
Only confirmed events ( hard state) are taken in account.
It’s possible to generate the report on less than 4 parts. If you don’t want to use one part, juste use the value -1 on its title.
Parameters
Parameters needed by the report are :
Parameters |
Type |
Description |
|---|---|---|
title |
Text field |
title for the first part of the report |
Hostgroups |
Multi select |
Hostgroups to use in the part 1 of the report |
Host category |
Multi select |
Hostcategories to use in the part 1 of the report |
title |
Text field |
title for the second part of the report |
Hostgroups |
Multi select |
Hostgroups to use in the part 2 of the report t |
Host category |
Multi select |
Hostcategories to use in the part 2 of the report |
title |
Text field |
title for the third part of the report |
Hostgroups |
Multi Select |
Hostgroups to use in the part 3 of the report |
Host category |
Multi select |
Hostcategories to use in the part 3 of the report |
title |
Text field |
title for the fourth part of the report |
Hostgroups |
Multi select |
Hostgroups to use in the part 4 of the report |
Host category |
Multi select |
Hostcategories to use in the part 4 of the report |
sort_by |
Radio button |
Sort results by state, duration or hostname |
display_ack |
Radio button |
Display or filter acknowledged hosts |
display_downtimes |
Radio button |
Display of filter hosts in downtime |