Hostgroup-Traffic-average-By-Interface
Description
Goal:
This report shows the average usage of network interfaces brandwidth, for a given hostgroup.
How to interpret the report?
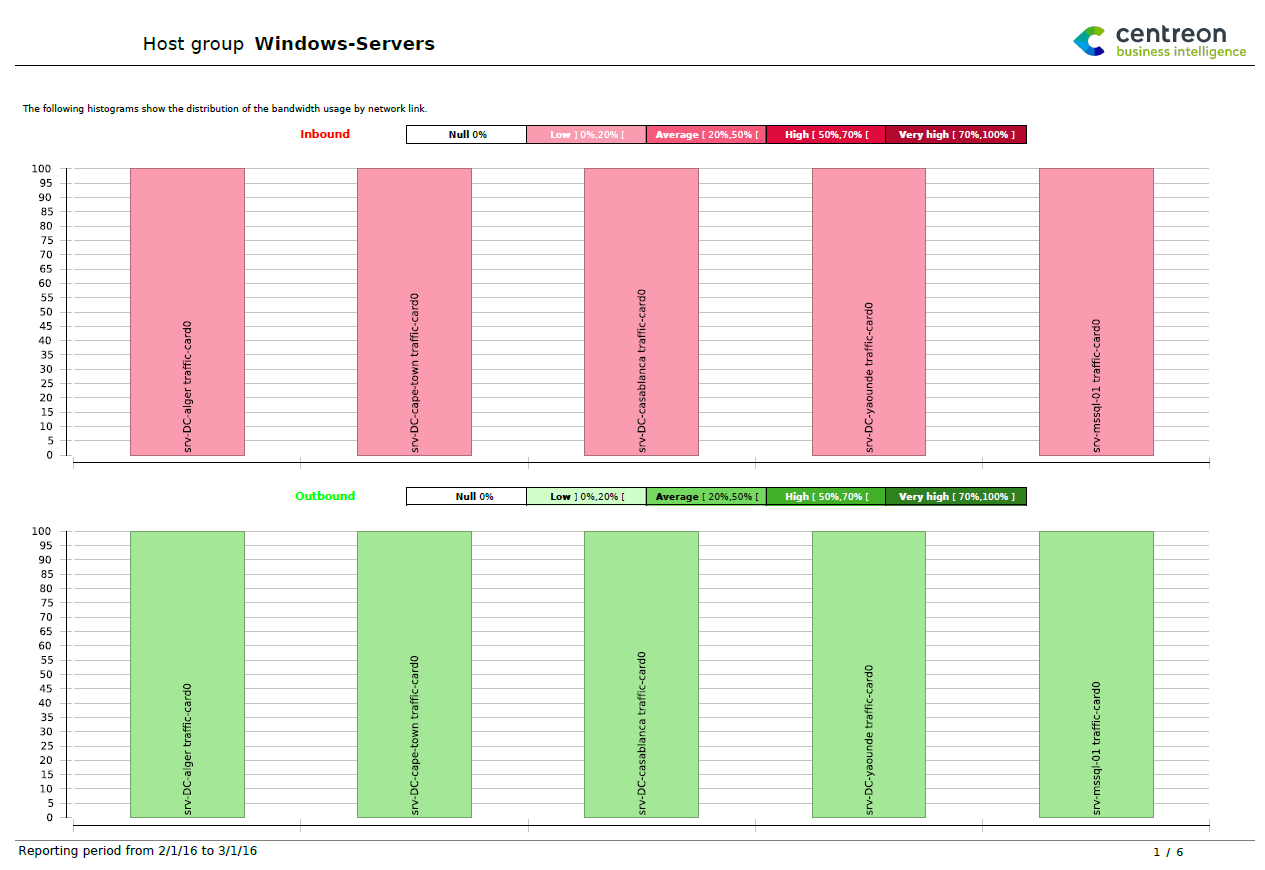
First page
On the first page,we can see the distribution of bandwidth usage in percent per interval.
Intervals are:
Null usage
Low usage
Average usage
High usage
Very high usage
These intervals are configurable.
Next pages
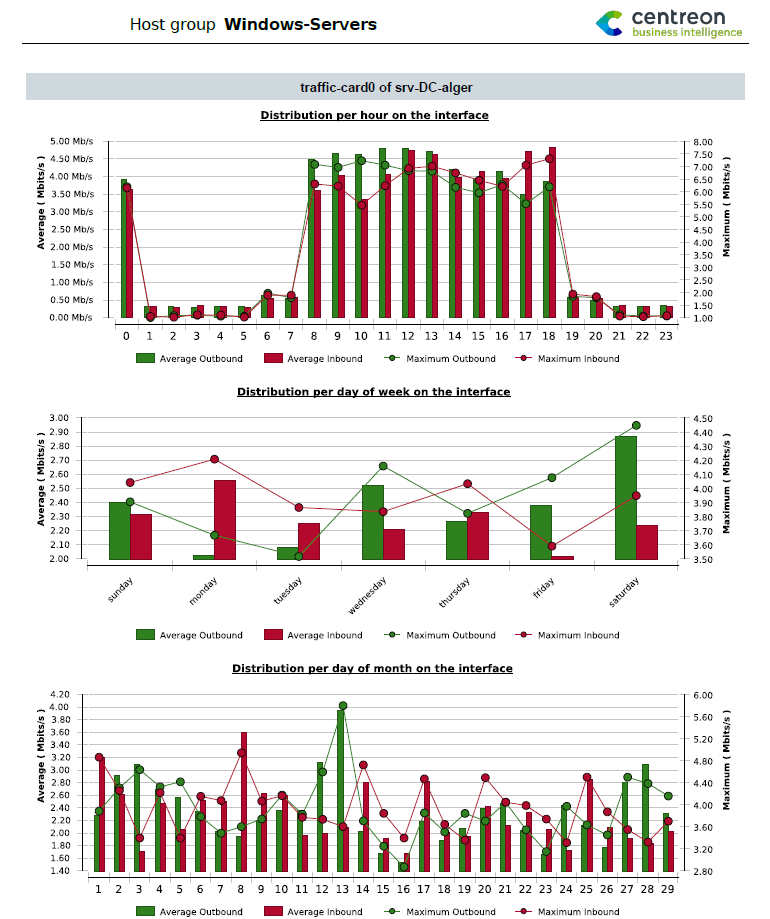
The next pages are automatically generated for all interfaces of the selected hostgroup ( one page per interface). Each page dispays the bandwidth distribution by:
Hour of the day displaying:
The average usage by hour of the day of incoming and outgoing traffic of the selected reporting period.
The maximum reached of incoming and outgoing traffic per hour of the day on the reporting period.
Day of the week displaying
The average usage by day of the week of incoming and outgoing traffic of the selected reporting period.
The maximum reached of incoming and outgoing traffic per day of the week on the reporting period.
Day of the month displaying
The average usage by day of the month of incoming and outgoing traffic of the selected reporting period.
The maximum reached of incoming and outgoing traffic per day of the month on the reporting period.
Parameters
Parameters needed by the report are:
The reporting period
The following Centreon objects:
Parameter |
Parameter type |
Description |
|---|---|---|
Hostgroups |
Dropdown list |
Host Group to use |
Host Categories |
Multi select |
Host Categories to use |
Service Categories |
Multi select |
Service categories to use |
Low level treshold (%) |
Number |
Low threshold of bandwidth usage (between 0 and 100) |
Average level treshold (%) |
Number |
Average threshold of brandwidh usage (between 0 and 100) |
High level treshold (%) |
Number |
High threshold of brandwidh usage (between 0 and 100) |
Inbound traffic metric |
Dropdown list |
Metric name of the inbound traffic |
Outbound traffic metric |
Dropdown list |
Metric name of the outbound traffic |
It is important to make sure that plugins return the maximum value because lot of statistics are based on percentage, calculated using this maximum value. Be sure that the trafic plugins return thione metric for traffic in and one for traffic out. The unit must be Bits/sec.
Prerequisites
To ensure consistency in graphs and statistics, some prerequisites are necessary regarding to performance data returned by plugins.
Performance data are data returned by a plugin after the “pipe” - “|” , these data have to be returned as follow:
output-plugin | traffic_in=valueunit;warning_treshold;critical_treshold;minimum;maximum traffic_out=value
It is important to make sure that plugins return the maximum value because lot of statistics are based on percentage, calculated using this maximum value. Be sure that the traffic plugins return one metric for traffic in and one for traffic out. The unit must be Bits/sec.