Hostgroup-Electricity-Consumption-1
Description
This report displays statistics of the electricity consumption of your equipments plugged into a UPS.
How to interpret the report?
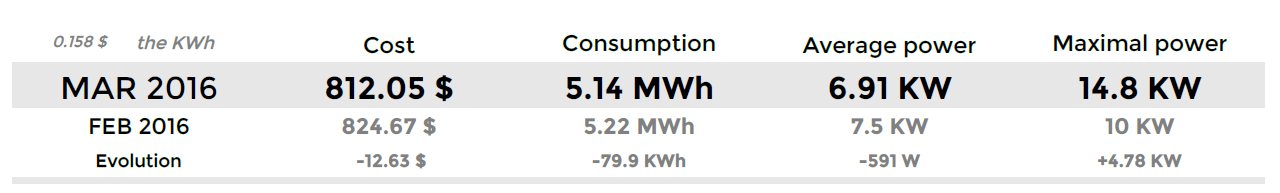
For a given hostgroup, a reporting period and a price per Kilowatthour, the first table displays the cost, the consumption, the average power and the maximal power reached on the month N. A reminder of these values on the previous month and the evolution.
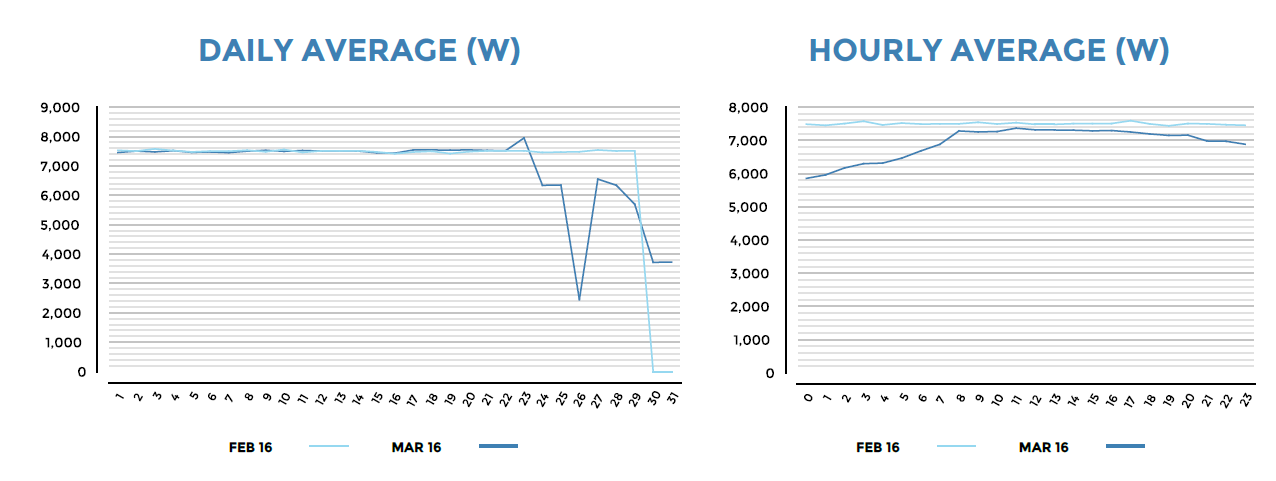
The two next graphs diplay the average power used per day of month and per hour of day. A comparaison with the previous month is visible on the same graphs.
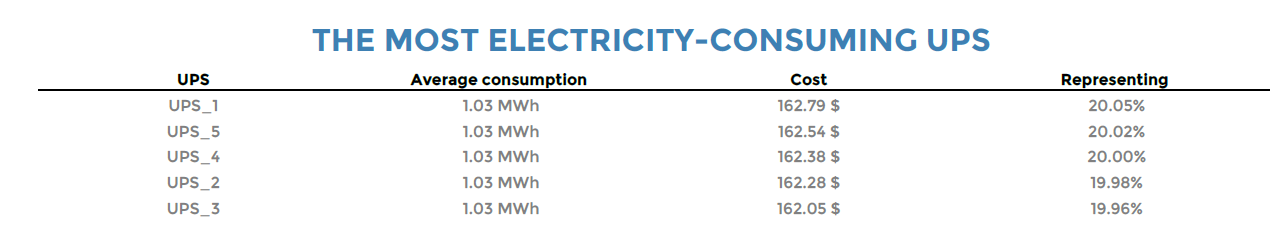
Then, a TOP 5 of the most consumer UPS, displaying the consumption distribution by UPS, the average consumption and the cost by UPS.
Note
If the hostgroup containts more that 5 UPS, only the four most consumer will be displayed; The fifth categorie will contain the rest of UPS.
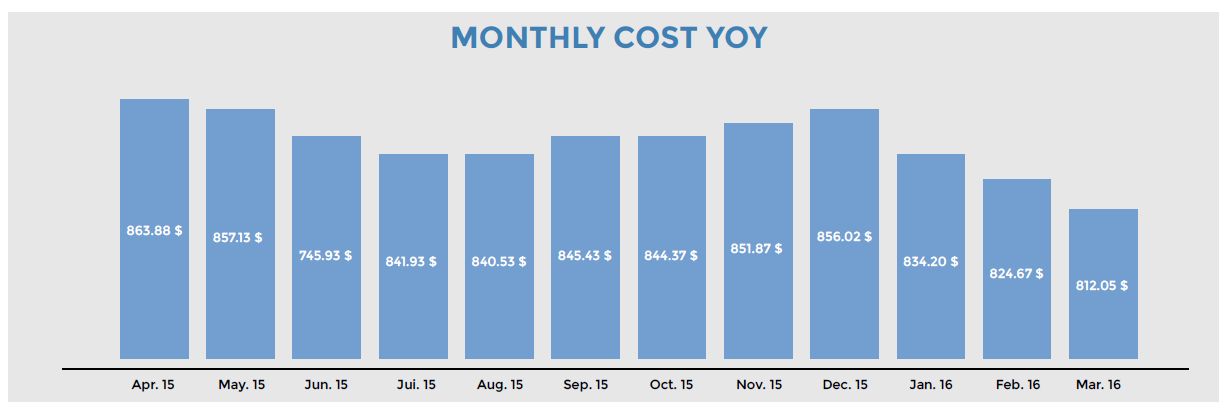
Finally, a graph displaying the monthly cost YoY.
Parameters
Parameters needed by the report are:
The reporting period.
The following Centreon objects :
Paramètres |
Type |
Description |
|---|---|---|
Time period |
Dropdown list |
Time period to use |
Host group |
Dropdown list |
Select the hostgroup to use |
Host category |
Multi select |
Select Host categories to use |
Service category |
Multi select |
Select Service Categories containing the power indicators |
Select metrics to include |
Multi select |
Select the metric name of the output power |
Prix KWh |
Text |
enter the price of the kilowatthour |
Prerequisites
The prerequisites for the proper functioning of the report are:
The monitoring of the output power of UPS.
A service category containing all the power indicators.
Enough historical data needed for the evolution graphs.
Note
The UPS consumption corresponds to the consumption of all equipments plugged into the UPS.