Hostgroup-Host-Event-Pareto
Description
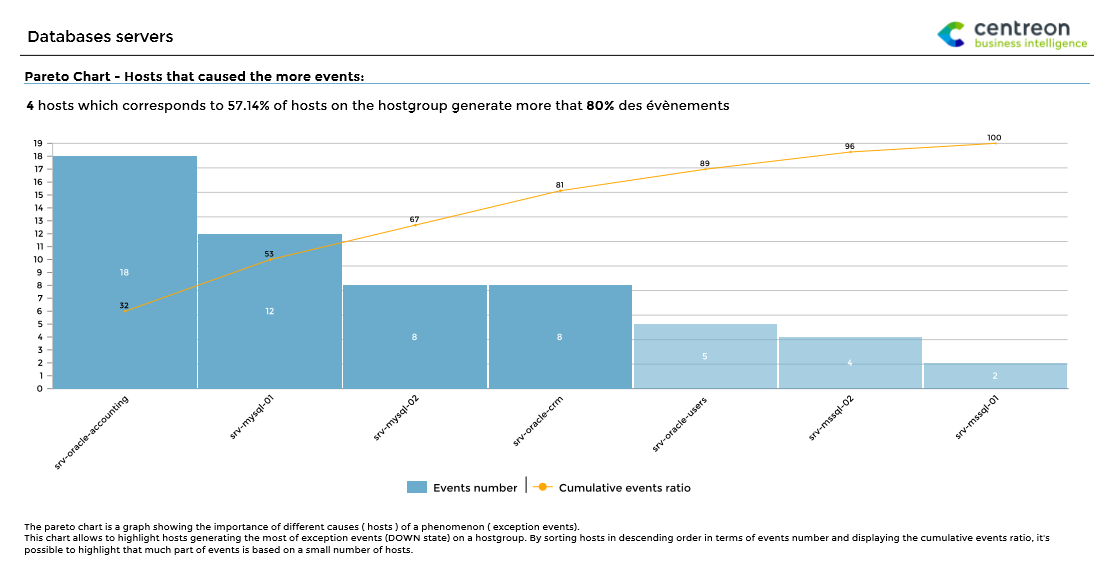
This report allows the identification of hosts responsible of the largest number of exception events in a hostgroup. The representation is made as Pareto diagram
How to interpret this report?
Hosts responsible of 80% of events are highlighted. Hosts are sorted in descending order in terms of number of generated events. The cumulative events ratio is also diplayed.
This report helps you to focus on the most problematic hosts exploiting the Pareto principle or the 80-20 rule: it’s a principle that says that approximately 80% of the effects come from 20% of the causes.
Parameters
Parameters needed by report are:
The reporting period
The following Centreon object:
Parameter |
Parameter type |
Description |
|---|---|---|
Host group |
Drop-down list |
Host group to use |
Hosts Categories |
Multi select |
Hosts categories to use |
Time period |
Drop-down list |
Time period to use |