Hostgroup-Storage-Capacity-2
Description
Goal: This report gives detailed storage statistics and the storage space evolution of your infrastructure.
How to interpret the report?
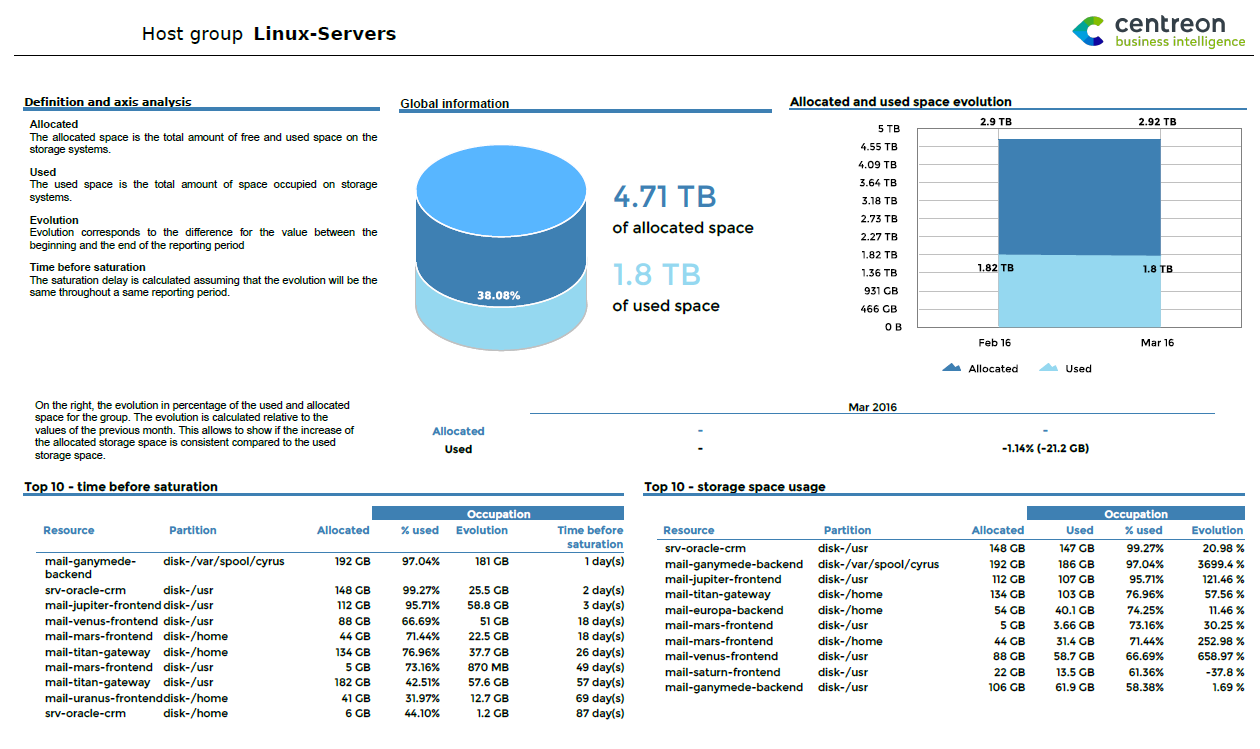
On the first page, a gobal information about the total used and allocated space for the reporting period are diplayed. A graph which trace the evolution of these two parameters on the past is also available.
Then the most critical equipments are diplayed in two top tables.
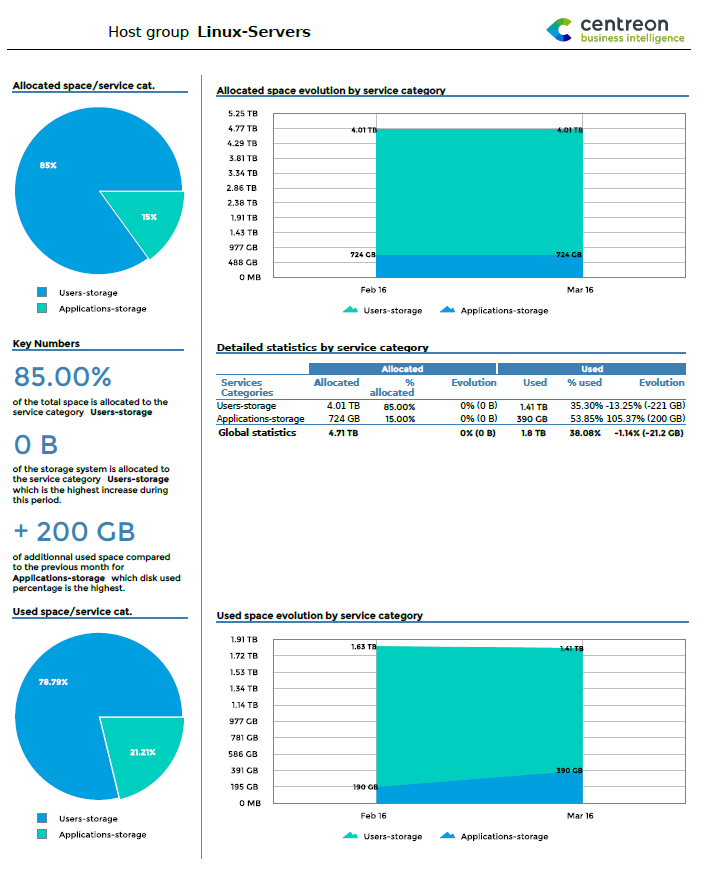
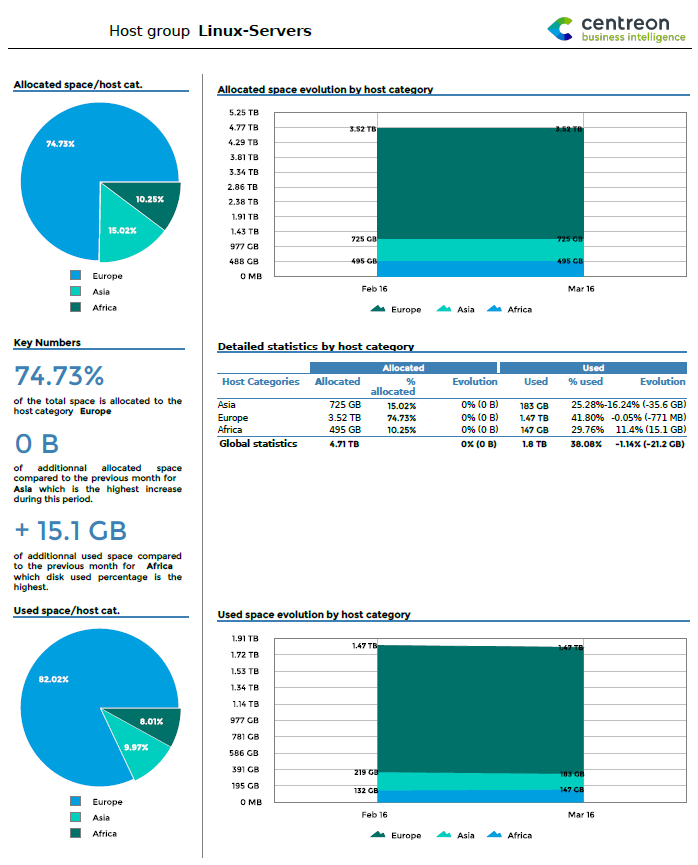
On the second and third pages,used and allocated space statistics are detailed by service categories and by host categories.
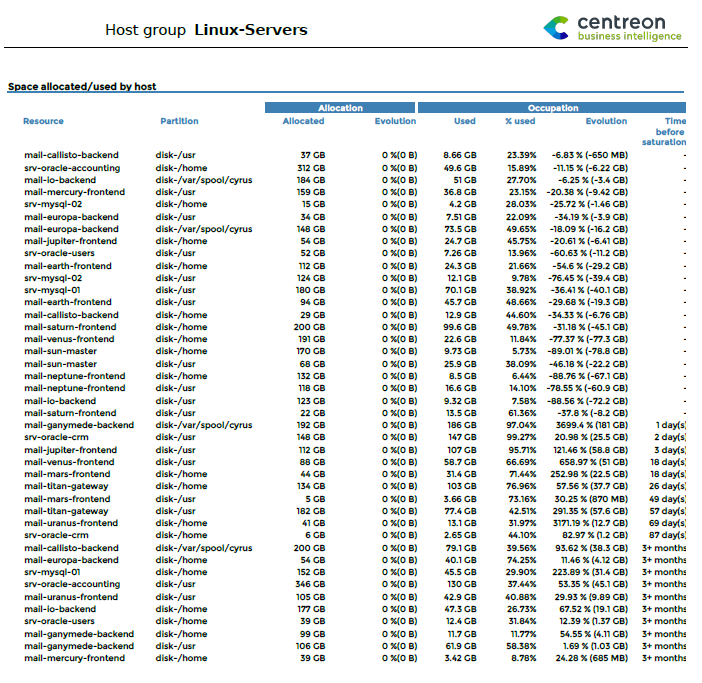
On the fourth page, a list of all storage spaces of the host group is displayed, with the the allocated and used space for each partition, the evolution relative to the last month, and previsions about time before saturation.
First page
Fourth page
Note
Statistics displayed in evolution tables and graphs by months correspond to values of indicators measured the last day of concerned months. « Snapshot » statistics ( versus evolution statistics by month ) correspond to values of indicators measured the last day of the reporting period. When an evolution calculation is done, it is calculated comparing values of indicators the last day of the reporting period and the values of indicators the day before the first day of the reporting period.
Parameters
Parameters needed are
The reporting period
The following Centreon objects:
Parameters |
Parameter type |
Description |
|---|---|---|
Host group |
Dropdown list |
Hostgroup to use |
Host categories |
Multi select |
Host categories to use |
Service categories |
Mutli select |
Storage Service categories to use |
Metrics |
Mutli select |
Metric to exclude from the list |
Time period |
Dropdown list |
Time period to use. /!Only the timeperiod 24x7 should be used /! |
Theme |
Dropdown list |
Theme to use |
Intervalle |
Text field |
Number of month to display in evolution graphs |
Prerequisites
To ensure consistency in graphs and statistics, some prerequisites are necessary regarding to performance data returned by plugins. Performance data are data returned by a plugin after the « pipe » , these data have to be returned as follow follow ::
output-plugin | metric1=valueunit;warning_treshold;critical_treshold;minimum;maximum metric2=value...
It is important to make sure that plugins return the maximum value because lot of statistics are based on percentage, calculated using this maximum value. Be sure that the storage plugins and memory plugin return this maximum value. The unit must be Bytes.
Warning
This report is compatible with the timeperiod 24x7 only. This timeperiod have to be configured on the menu “General options | Capacity statistic agregated by month | Live services for capacity statistics calculation”