Hostgroup-Capacity-Planning-Linear-Regression
Description
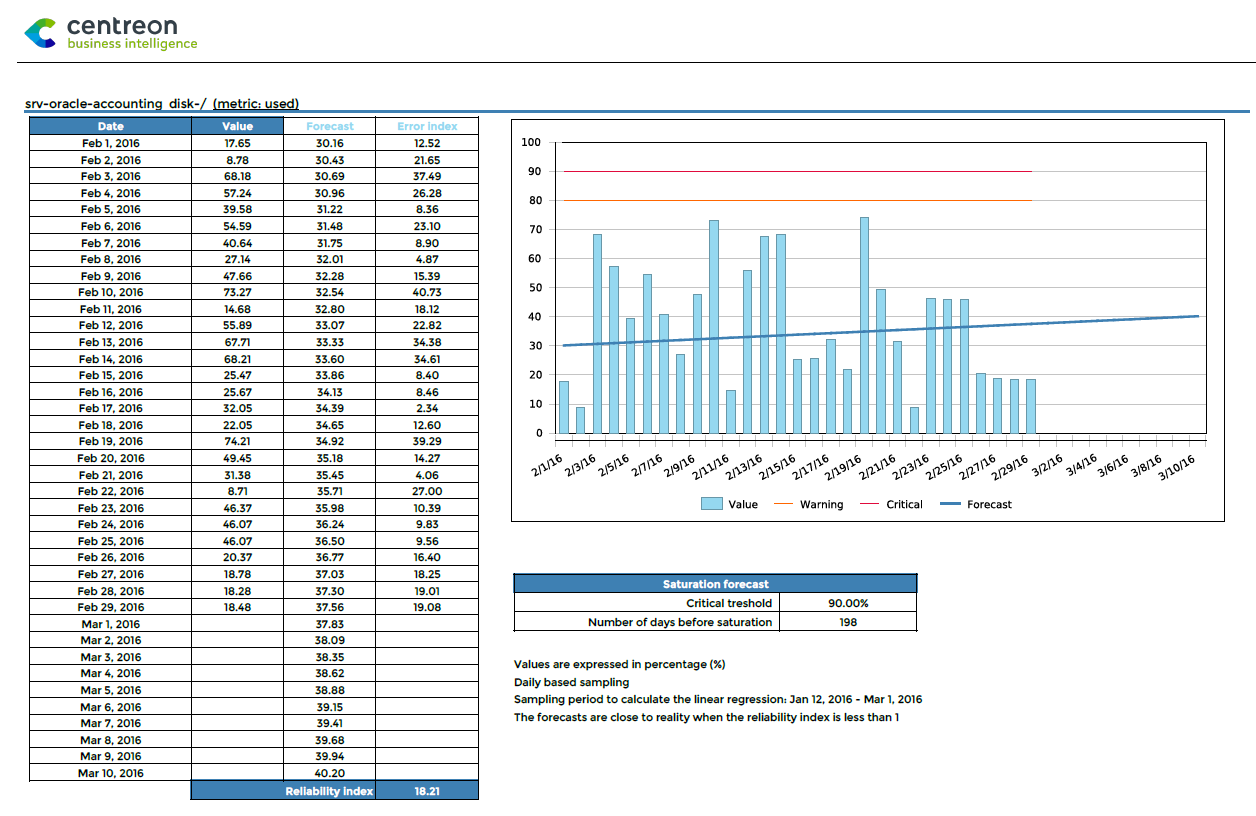
Goal:
This report displayed the evolution and forecast of performance metrics, for a hostgroup
How to interpet the report?
The metrics value evolution is displayed on a graph and a table. Forecasts are calculated from the reporting period metrics value, and projected in the futur. Another table gives information about metrics progression and days before saturation.
Parameters
Parameters needed by report are:
The reporting period
The following Centreon object:
Parameter |
Parameter type |
Description |
|---|---|---|
Host groups |
Multi select |
Host groups to filter on |
Host Categories |
Multi select |
Selection of host Categories to filter on |
Services Categories |
Multi select |
Selection of service Categories to filter on |
Time period |
Dropdown list |
Time period to report. |
Metrics |
Multi select |
Metric to include in the report |
Historical period in days in addition of the reporting period |
Number |
Days used to calcutate the linear regression in addition to the reporting period |
Forecast period in days |
Number |
Forecast days calculated by linear regression |
Prerequisites:
Metrics must return a max value on their performances data. Using Warning and critical thresholds on performances data is highly recommanded
Performance data are data returned by a plugin after the “pipe” - “|” , these data have to be returned as follow:
output-plugin | metric1=valeur(unité);seuil_warning;seuil_critique;minimum;maximum metric2=valeur . . .