Host-Graphs-V2
Description
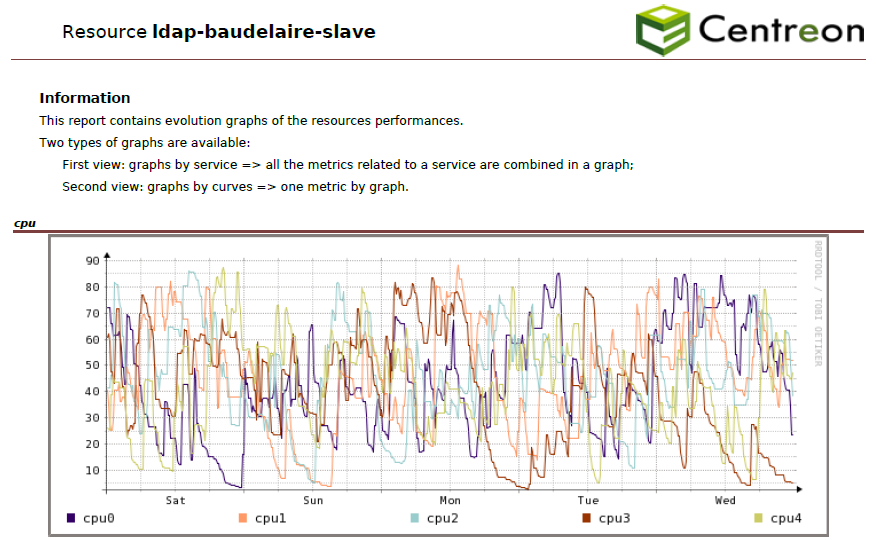
Goal:
This report shows the evolution and performance RRD graphs of centreon’s services, on a defined period.
Parameters
Parameters needed by report are:
The reporting period
The following Centreon object:
Parameter |
Parameter type |
Description |
|---|---|---|
Host |
Selection |
Host selection |
Service Categories |
Multi select |
Services Category to use |
Metrics |
Multi select |
Metrics to use. If no metric is selected, graphs by metric will not displayed. |
Graphs display rule |
Check box |
Sets whether you want to see all the metrics on one graph for each service, a graph by metric, or both |
Prerequisites
Go to “Reporting > Business Intelligence > General Options > Scheduler Options” and configure the field:

To be able to export RRD graphs using Centreon’API, the reporting server needs to access Centreon’API using HTTP or HTTPS protocole. This mean, from the reporting, the following curl command has to work and generate a image file.
curl https://$CENTREON-IP-OR-DNS$//include/views/graphs/generateGraphs/generateImage.php?akey=$AUTH_KEY$&username=$USER$&hostname=$HOSTNAME$&service=$SERVICENAME$&start=$TIMESTAMPSTART$&end=$TIMESTAMPEND$
Replace the ‘$xxxx$’ by real values
Example :
http://centreon.enterprise.com//include/views/graphs/generateGraphs/generateImage.php?akey=af9c583c5f31bd2459c07&username=myUser&hostname=host-1&service=cpu&start=1490997600&end=1493157600