VMWare-VM-Performances-List
Description
This report displays statistics on usage of the vCPU, memory and IOPS on virtual machines.
It has been optimized for generating XLSX files to create the desired filters and perform sorting.
How to interpret the report
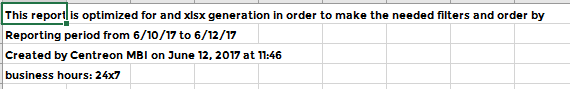
The first tab shows information on the reporting period, the live-service period selected and the report generation day and time.
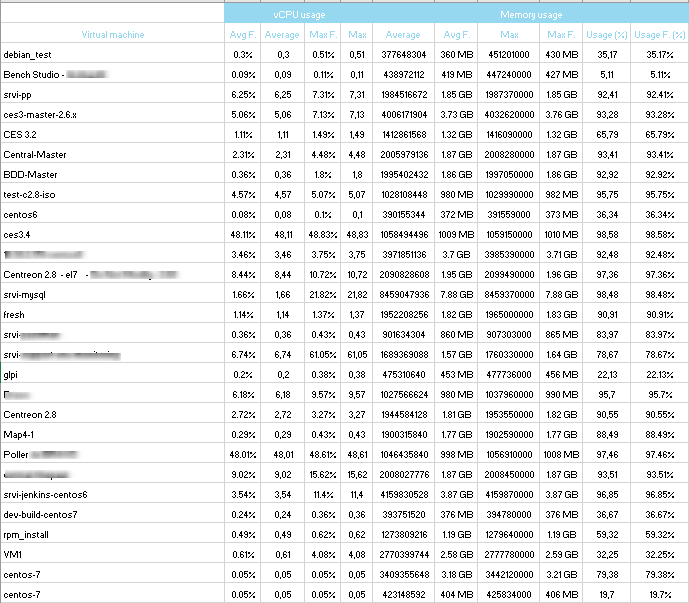
The second tab lists the virtual machines with vCPU usage (average, average formatted, max, max formatted) and memory usage (average, average formatted, max, max formatted, % of usage, % of usage formatted).
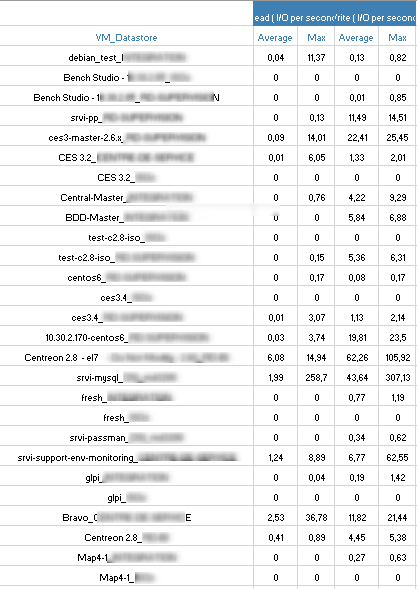
The last tab lists the virtual machines by datastore and their read/write IOPS usage showing the average and the maximum reached.
Parameters
Parameters required for the report:
The reporting period
The following Centreon objects:
Parameters |
Type |
Description |
|---|---|---|
Time period |
Dropdown list |
Specify the reporting live service. |
Host to report |
Dropdown list |
Select the VCenter for report. |
Host category |
Multi selection |
Select host category for filter. |
Service category |
Multi selection |
Select service category containing the global VM statistics. |
Prerequisites
This report is developped for full compatibility with the Virt-VMware2-ESX plugin pack and Centreon-VMWare-2.0 connector. Certain prerequisites apply to ensure proper report creation:
Monitoring of the following indicators:
Vm-Cpu-Global service
Vm-Memory-Global service
Vm-Datastore-Iops-Global service.
Creation of the following service category:
VM-Statistics with these indicators: Vm-Cpu-Global, Vm-Memory-Global and Vm-Datastore-Iops-Global.