Hostgroups-Host-Current-Events
Description
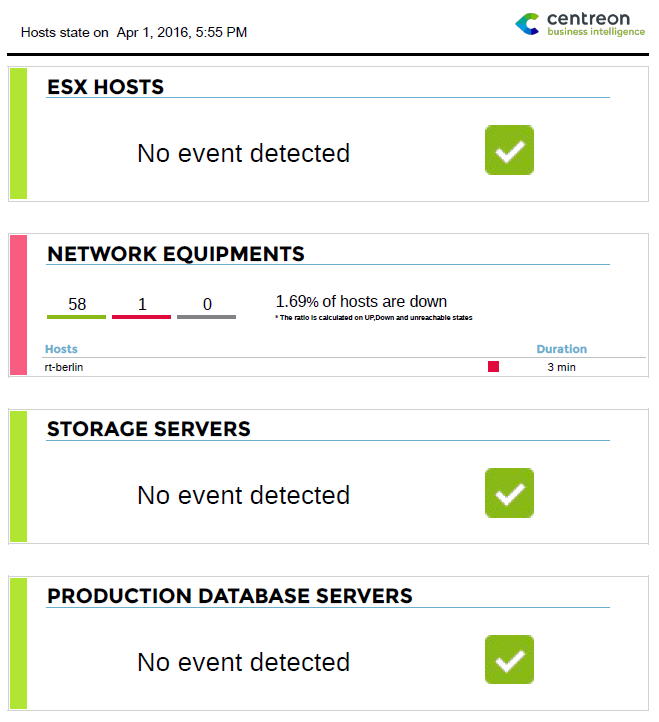
This report displays the events occuring on hosts at the time it is generated.
How to interpret the report
The report consists of four parts. On each part, you can use a filter to select a restricted perimeter for host groups and host categories. Data is displayed with real-time results when the report is generated. In addition:
Events can be sorted by state, duration or hostname.
You can display and/or filter acknowledged hosts or hosts in downtime.
Only confirmed events (hard state) are taken in account.
A report can have less than four parts by specifying the value -1 in its title.
Parameters
Parameters required for the report:
Parameters |
Type |
Description |
|---|---|---|
title |
Text field |
Specify the title for part 1 of report. |
Hostgroups |
Multi select |
Select host groups for part 1 of report. |
Host category |
Multi select |
Select host categories for part 2 of report. |
title |
Text field |
Specify title for part 2 of report. |
Hostgroups |
Multi select |
Select host groups for part 2 of report. |
Host category |
Multi select |
Specify host categories for part 2 of report. |
title |
Text field |
Specify title for part 3 of report. |
Hostgroups |
Multi Select |
Select host groups to use for part 3 of report. |
Host category |
Multi select |
Select host categories for part 3 of report. |
title |
Text field |
Specify title for part 4 of report. |
Hostgroups |
Multi select |
Specify host groups for part 4 of report. |
Host category |
Multi select |
Select host categories for part 4 of report. |
sort_by |
Radio button |
Sort results by state, duration or host name. |
display_ack |
Radio button |
Display or filter acknowledged hosts. |
display_downtimes |
Radio button |
Display or filter hosts in downtime. |