Hostgroup-Graphs-v2
Description
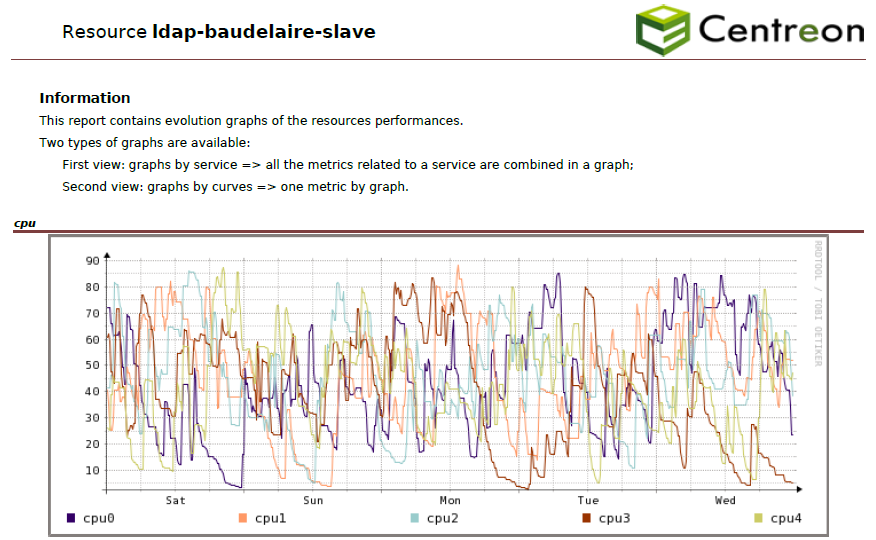
This report presents round-robin database (RRD) graphs for the evolution and performance of Centreon services for a given host group over a defined period.
Parameters
Parameters required for the report:
Reporting period
The following Centreon objects:
Parameter |
Parameter type |
Description |
|---|---|---|
Report title |
Text |
Select title on cover page and report header. |
Host group |
Drop-down list |
Select host group. |
Service Categories |
Multi select |
Select service category. |
Hosts Categories |
Multi select |
Select host categories. |
Metrics |
Multi select |
Select metrics. If no metric is selected, graphs by metric will not be displayed. |
Graphs display rule |
Check box |
Specify whether you want to see all the metrics on one graph for each service, a graph by metric, or both. |
Prerequisites
Go to “Reporting > Business Intelligence > General Options > Scheduler Options” and configure the following field:

In order to export RRD graphs using the Centreon API, the reporting server needs to access it using HTTP or HTTPS protocole. A curl command sent to the URL of the API should generate an image file.
curl https://$CENTREON-IP-OR-DNS$//include/views/graphs/generateGraphs/generateImage.php?akey=$AUTH_KEY$&username=$USER$&hostname=$HOSTNAME$&service=$SERVICENAME$&start=$TIMESTAMPSTART$&end=$TIMESTAMPEND$
Replace the ‘$xxxx$’ by real values.
Example:
http://centreon.enterprise.com//include/views/graphs/generateGraphs/generateImage.php?akey=af9c583c5f31bd2459c07&username=myUser&hostname=host-1&service=cpu&start=1490997600&end=1493157600