Hostgroup-Storage-Capacity-List
Description
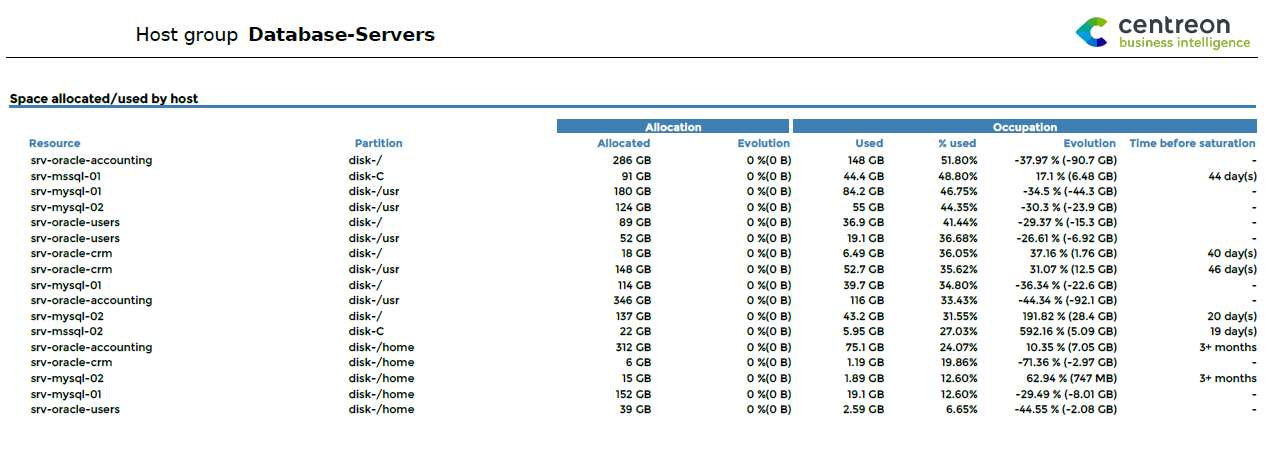
This report displays storage space usage on hosts within a host group.
How to interpret the report
The report presents a table with all available partitions for hostgroup’s ressources. Detailed information is provided on the allocated and used space, the evolution since the last month, and estimate time before saturation.
Note
Statistics displayed in evolution tables and graphs by month correspond to values of indicators measured on the last day of the month. “Snapshot” statistics (versus evolution statistics by month) correspond to values of indicators measured the last day of the reporting period. Evolution calculations are based on comparing the values of indicators the last day of the reporting period with the values of indicators the day before the first day of the reporting period.
Parameters
Parameters required for the report:
Reporting period
The following Centreon objects:
Parameter |
Parameter type |
Description |
|---|---|---|
Hostgroup |
Dropdown list |
Select host group. |
Host categories |
Multi select |
Select host categories |
Service categories |
Mutli select |
Select service categories |
Metrics |
Mutli select |
Metric to exclude from the list. |
Time period |
Dropdown list |
Specify time period. /!Only the timeperiod 24x7 should be used /! |
Prerequisites
For consistency in graphs and statistics, certain prerequisites apply to performance data returned by the storage plugins. This data must be formatted as follows, preceded by a pipe (|):
output-plugin | metric1=valueunit;warning_treshold;critical_treshold;minimum;maximum metric2=value...
Make sure that the plugins return the maximum value, which is required in order to calculate statistics. The unit must be expressed in bytes.