Hostgroup-Traffic-By-Interface-And-Bandwith-Ranges
Description
This report shows the average inbound and outbound bandwith usage of network interfaces for a given host group.
How to interpret the report
First page
The first page displays the bandwidth usage ranges in percentage by interval.
Intervals are:
Null usage
Low usage
Average usage
High usage
Very high usage.
These intervals are configurable.
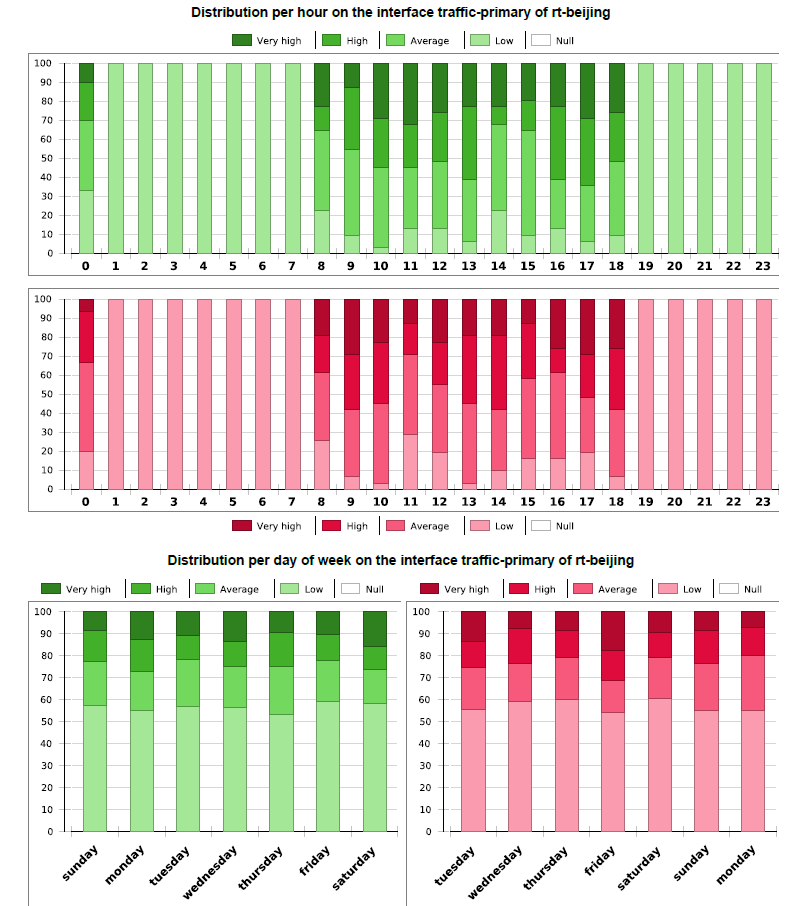
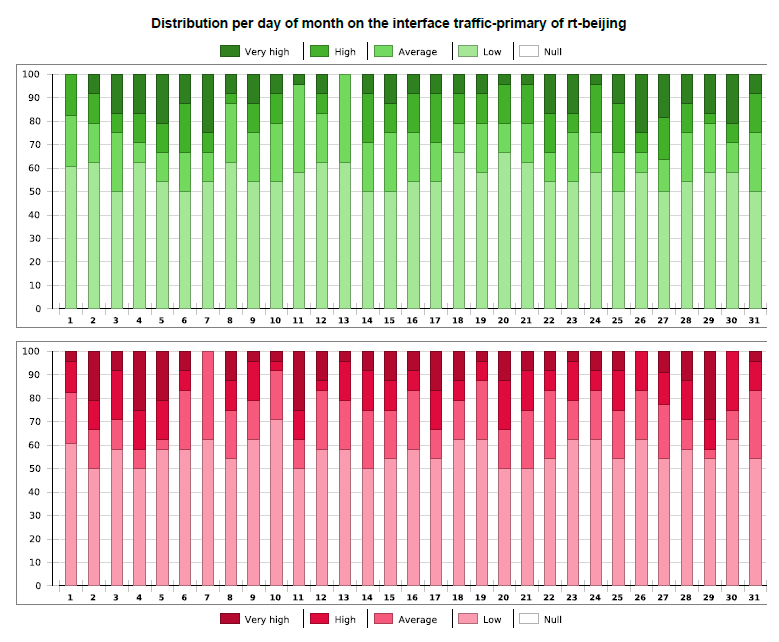
Following pages
The following pages are automatically generated for all interfaces of the selected host group (one page per interface). Each page dispays the bandwidth usage by interval with distribution by:
Hour of the day
Day of the week
Day of the month.
Parameters :
Parameters required for the report:
Reporting period
The following Centreon objects:
Parameter |
Parameter type |
Description |
|---|---|---|
Host Group |
Dropdown list |
Select host group. |
Host Categories |
Multi select |
Select host categories. |
Service Categories |
Multi select |
Select service categories. |
Low-level treshold (%) |
Number |
Specify low threshold of bandwidth usage (between 0 and 100). |
Average-level threshold (%) |
Number |
Average threshold of bandwidh usage (between 0 and 100) |
High-level threshold (%) |
Number |
Specify high threshold of bandwidth usage (between 0 and 100) |
Inbound traffic metric |
Dropdown list |
Specify metric of inbound traffic. |
Outbound traffic metric |
Dropdown list |
Specify metric of outbound traffic. |
Prerequisites :
For consistency in graphs and statistics, certain prerequisites apply to performance data returned by the storage plugins. This data must be formatted as follows, preceded by a pipe (|):
output-plugin | traffic_in=valueunit;warning_treshold;critical_treshold;minimum;maximum traffic_out=value
Make sure the plugins return the maximum value, which is required in order to calculate statistics. The storage plugins must return one metric for traffic in and one for traffic out. Units must be in Bits/sec.