Hostgroup-Service-Incident-Resolution-2
Description
This report displays the rate of acknowledged and resolved events, the longest-lasting events, the least reliable indicators, and hosts generating the most events for a given host group.
How to interpret the report
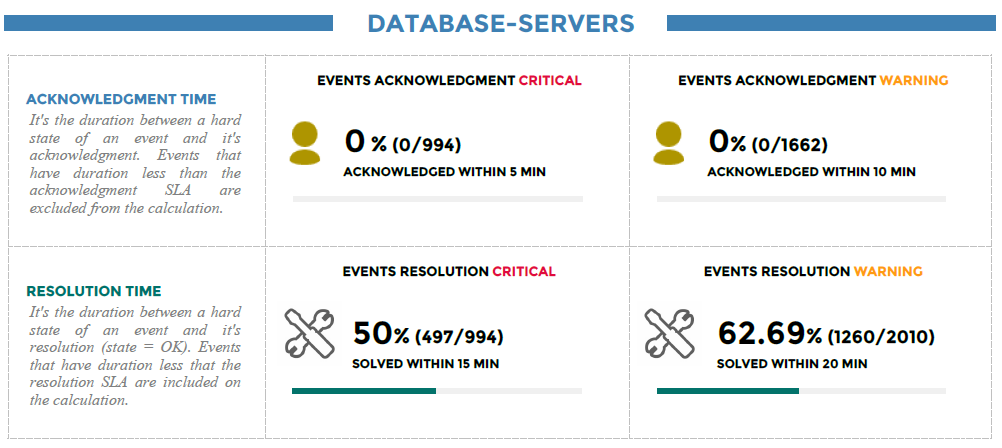
The first graphic displays the rate of acknowledged and resolved events within a specific time frame.
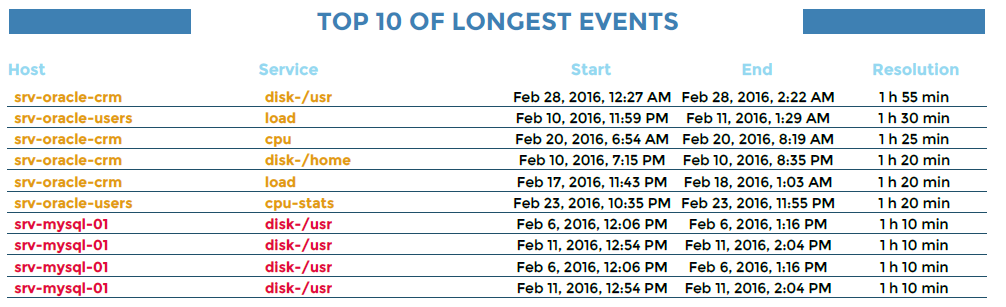
The second graphic displays the top 10 longest events with the start, end and resolution time.
Indicators in a critical-state appear in red, in a warning-state in orange, and an unknown state in gray.
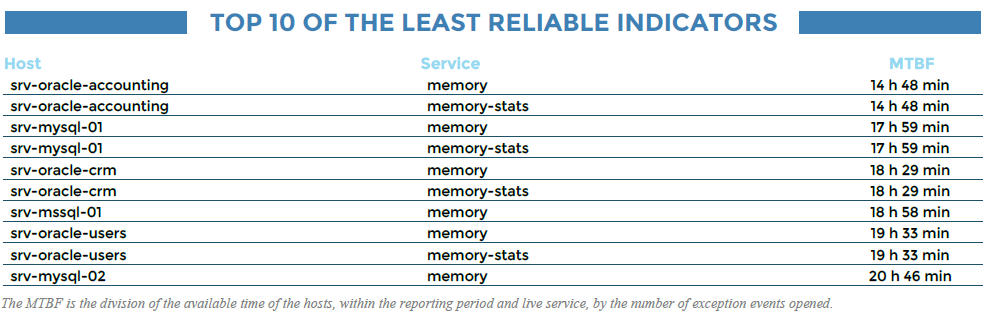
The third graphic in the report displays the top 10 the least reliable indicators.
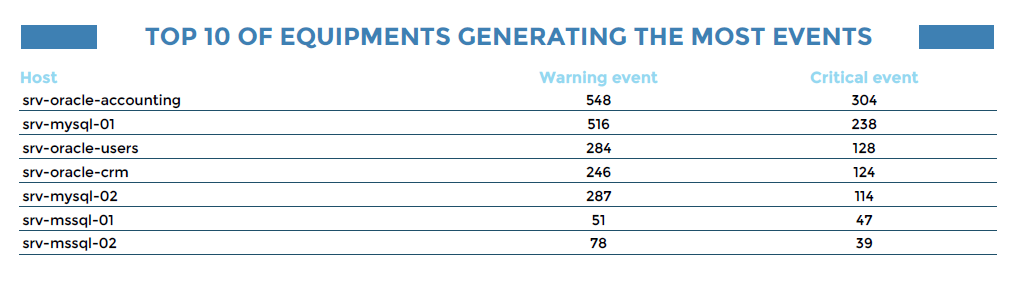
Finally, the top 10 hosts generating the most events.
Paramètres
Parameters required for the report:
Reporting period
SLA of acknowledgment in minutes
SLA of resolution in minutes
The number of rows to display in top objects
The following Centreon objects:
Paramètres |
Type |
Description |
|---|---|---|
Time period |
Drop-down list |
Specify time period. |
Host group |
Drop-down list |
Select host group. |
Host category |
Multi select |
Select host categories. |
Service category |
Multi select |
Select service categories. |