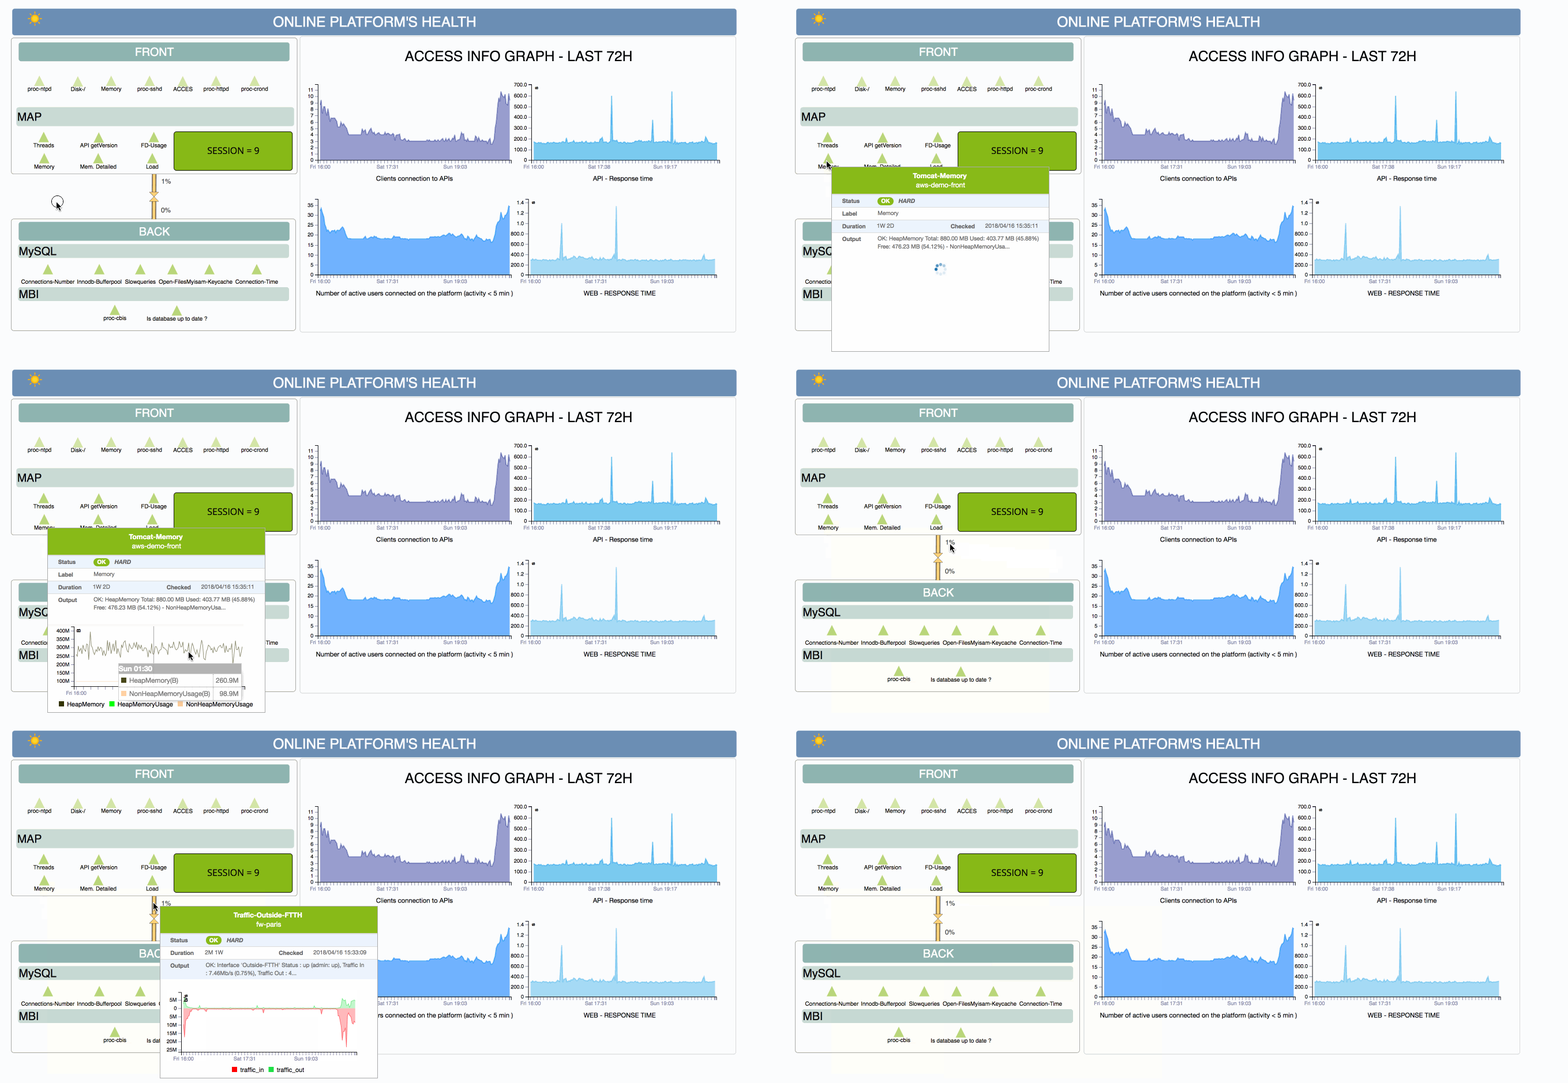
Understand tooltips
On the web interface, there are information windows called tooltips. They appear when you are mouse hovering some types of objects in a view: links (status & metric), services, metaservices, hosts, host groups and service groups. This window is kept open as long as your cursor is hover the tooltip.

Depending on the type of GUI object under your mouse, different information will be displayed. For instance, a link (status & metric, services and metaservice) would display:
Acknowledgement information (if present)
Downtime information (if present)
Duration
Output.
In the case of hosts, host groups and service objects, this “mouseover” summary information includes a list of the five most recently used resources in the sublevel that currently impact the host/host group or service group.
The following rules apply:
If a host is down, services attached are never displayed in a tooltip.
For a host: Services displayed correspond to the inherited status of the host. For example, if a host is “red”, then only Critical services will be displayed.
For a service group: Services displayed correspond to the inherited status of the service group.
For a host group: Hosts with the same status as the host group are displayed in a tooltip; and services (if their host is up) with the same inherited status as their host groups are displayed.
Note
In the customs views widget, by default, tooltips are not displayed. It is possible to activate them in the widget settings by a checkbox.