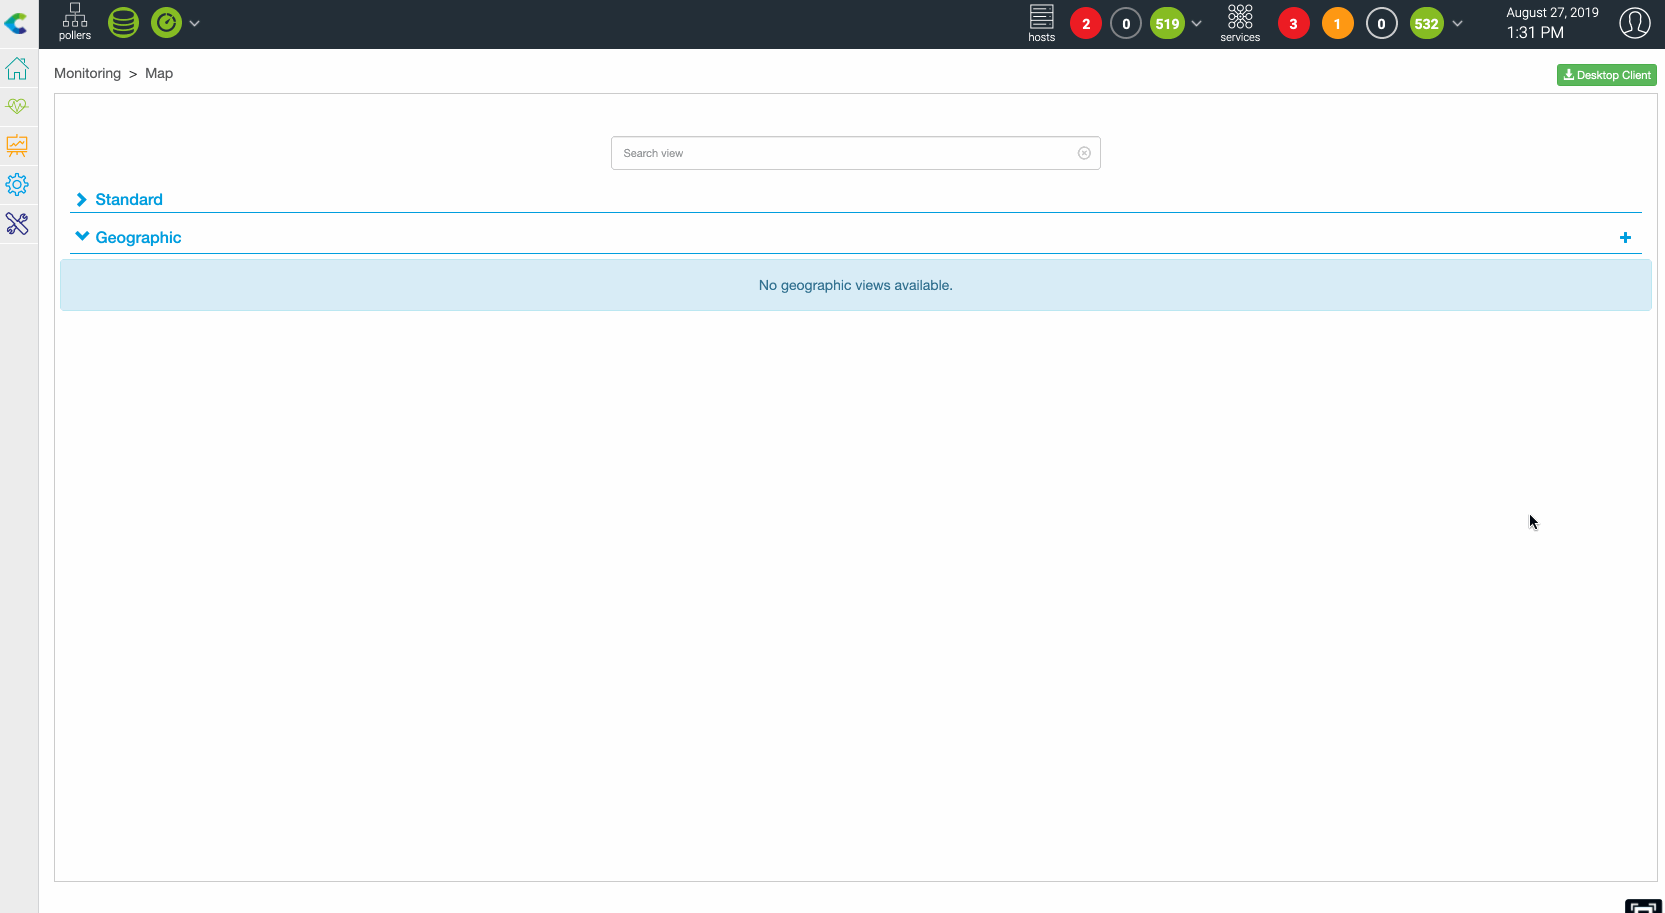
Create a GeoView
You can create geographic views using the web interface, to do so:
Go to Monitoring > Map and click on the “+” on the Geographic section.
You’re asked to give a name to the view and then to define resources to display on the view.
After configuring these parameters, resources will appear on this geographic view
The following resources can be displayed on a GeoView:
Hosts belonging to hostgroup(s)
Business Activity belonging to Business View(s)
One or multiple Hostgroup(s)
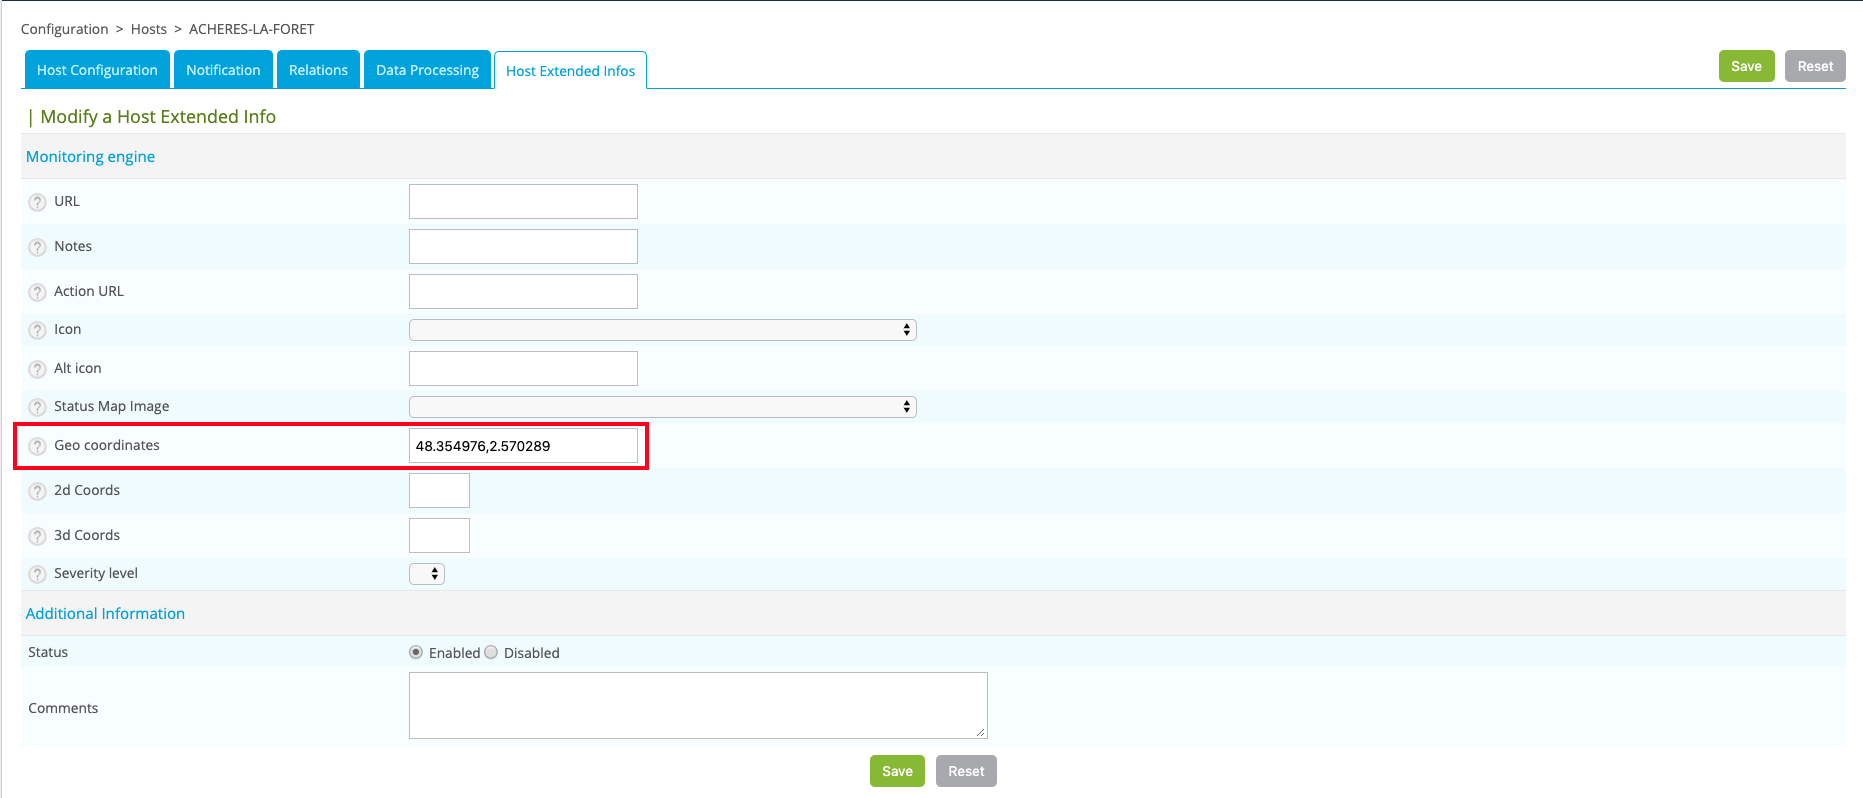
Pre-requisites: Define lat/long coordinate in the resources configuration form for host, hostgroups or business activity.
Example with a host:
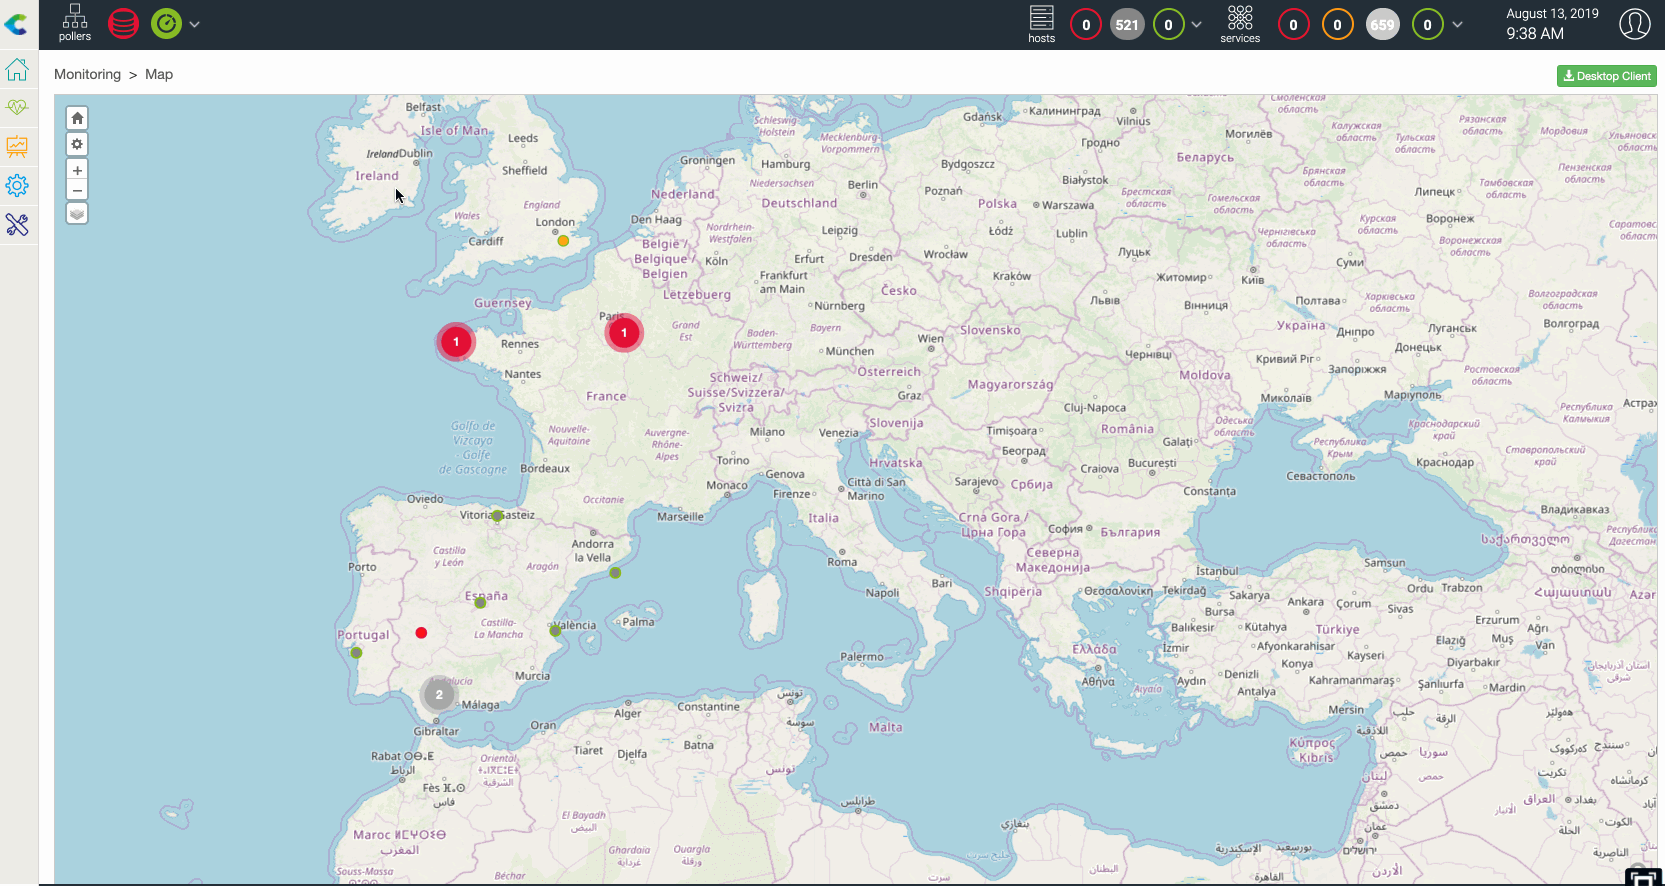
How resources are displayed?
When a resource (host, hostgroup or a business activity) is positionned on a geoview, it’s displayed as a circle which colored is defined using the following rules:
Host: worst state between the host and its services
Hostgroups: worst state of hosts belonging to the hostgroups
Business activity: current status
Worst state order: Critical (red) > Down (red) > Warning(orange) > Unknown(gray) > Unreachable(gray) > Ok(green) > Up(green) > Pending(blue)
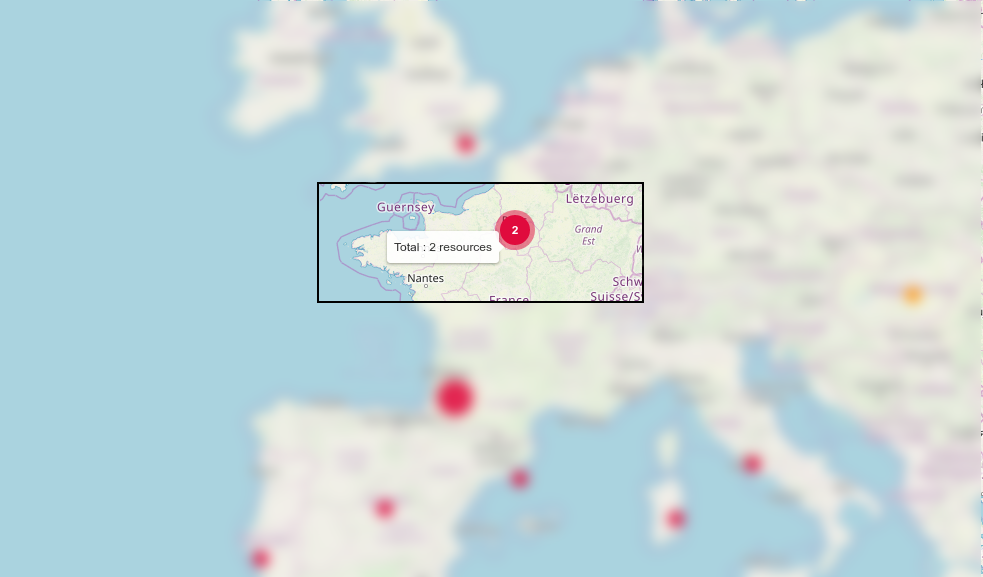
Clustering
When multiple resources are geographically close and you are at “certain” zoom level, then they’re grouped into one single circle displaying two things:
Status of the worst object (displayed as a color between green, orange, red and gray)
Number of resources in this state
This behavior can be disabled in the global Centreon Map parameters
Blinking resources
If a resources is in a “not-green” state, it blinks.
This behavior can be disabled in the global Centreon Map parameters
Datalayers on Geoview
Centreon MAP gives you the possibility to display additionnal “data layers” on maps to add context to your real time IT infrastructure status.
First you need to add data layers in Centreon Map option (here), then, if the data layer is enabled, you may make it visible or not by checking the concerned layer using the top left icon.
Examples