Metric capacity planning
Description
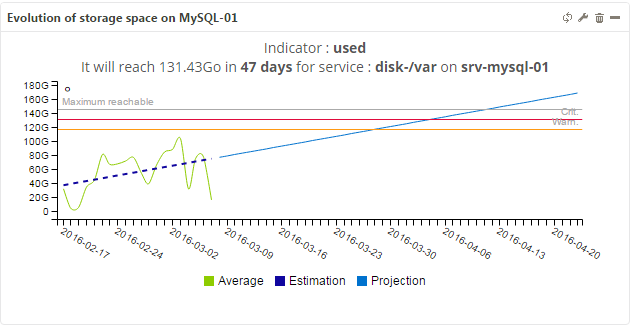
This widget displays the future evolution of a metric in relation to its history using linear regression.
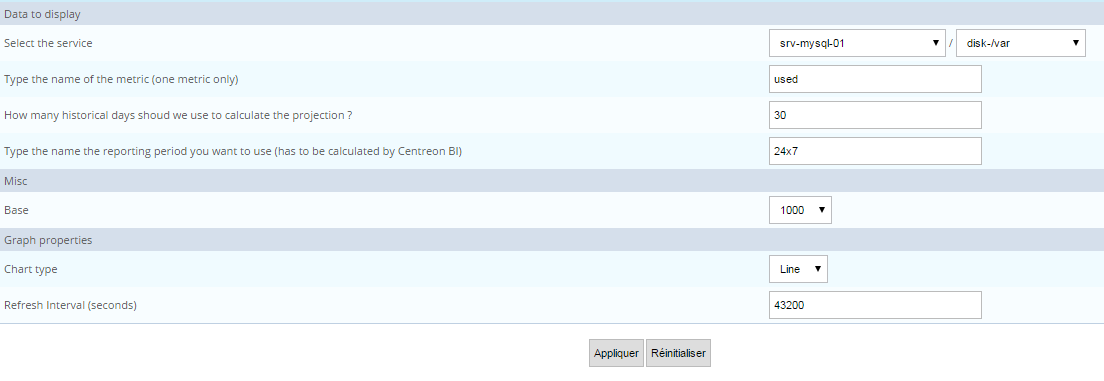
Parameters
Menu description
Select the service: Select the host followed by the service.
Type the name of the metric (one metric only): Enter metric pertaining to a service.
How many historical days should we use to calculate the projection: This period should show the evolution of the metric.
Type the name the reporting period you want to use (has to be calculated by Centreon BI).
Base: Base for division (1000 or 1024).
Chart type: Indicate type of graph for availability and performance.
Refresh Interval (seconds): Sets automatic refresh time for widgets.
Example