Hostgroups, categories performance analysis by day
Description
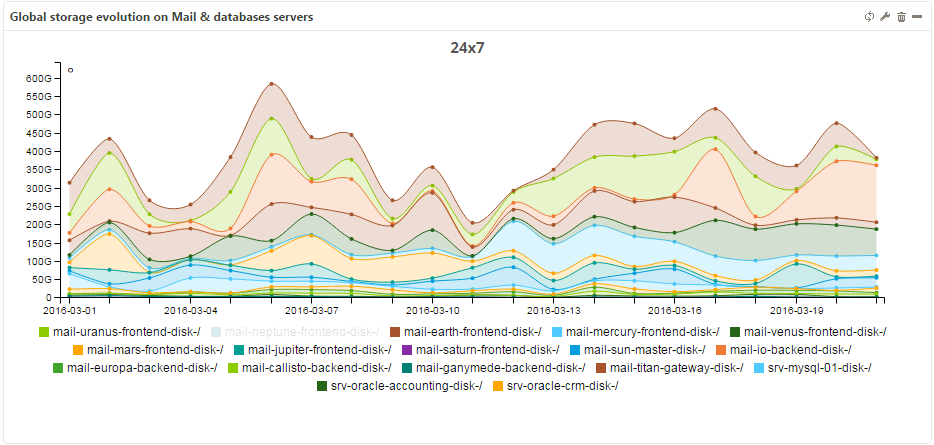
This widget displays performance data (minimum, average or maximum) by day over a defined period for groups and categories.
Parameters
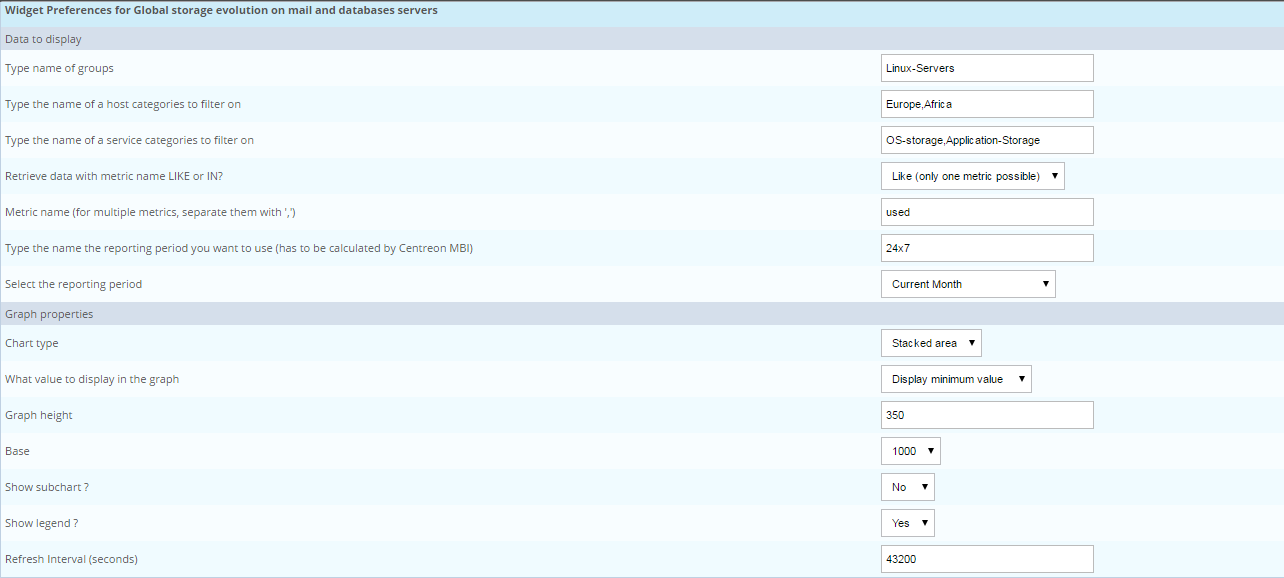
Menu description
Type name of groups: Separate multiple entries by a comma “,”.
Type the name of a host category to filter on: Separate multiple entries by a comma “,”.
Type the name of a service category to filter on: Separate multiple entries by a comma “,”.
Retrieve data with metric name LIKE or IN?: Use this method to filter on metric name.
Metric name (for multiple metrics, separate them with ‘,’): Type the name of the metric (if filter mode = like) or multiple metrics (if mode = IN).
Type the name of the reporting period you want to use (has to be calculated by Centreon MBI): Make sure the reporting period is preconfigured in MBI.
Select the reporting period.
What value to display in the graph: Use minimum, average or maximum value.
Graph height: Graph might need to be resized to include caption.
Base: Controls conversion to display G, M, K, etc.
Show subchart?: Display or hide the subchart for zooming in.
Show legend?: Display or hide the caption.
Refresh Interval (seconds): Sets automatic refresh time for widgets.
Example