Hostgroups performance metric - TOP X
Description
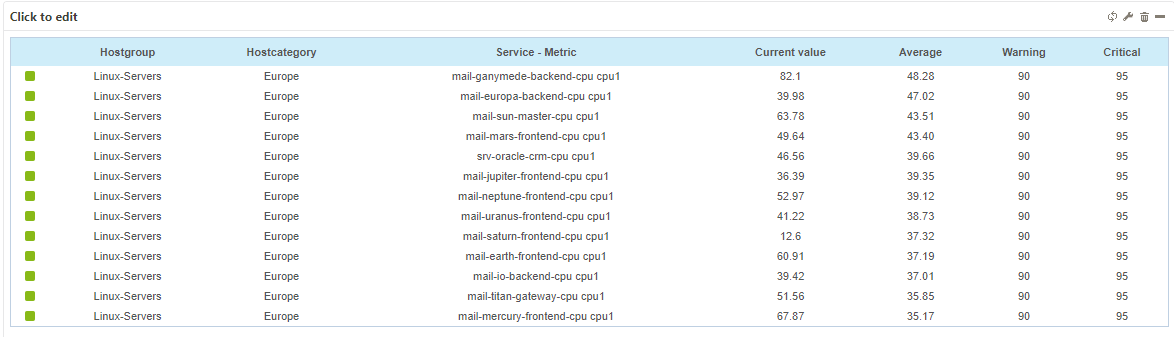
This widget displays a rating of top performance data by metric (i.e., current value, average, minimum, maximum, thresholds) for groups and categories.
Parameters
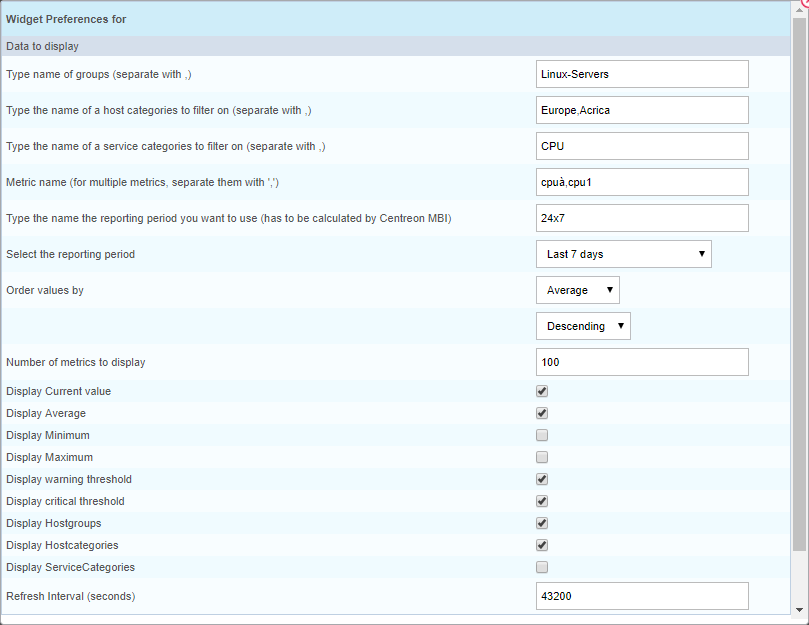
Menu description
Type name of groups (separate with ,).
Type the name of a host categories to filter on (separate with ,).
Type the name of a service categories to filter on (separate with ,).
Metric name (for multiple metrics, separate them with ‘,’).
Type the name the reporting period you want to use (has to be calculated by Centreon MBI): Make sure the reporting period is preconfigured in MBI.
Select the reporting period.
Order values by : average, minimum or maximum, ascending or descending.
Number of metrics to display: Top N to display in terms of metrics.
Display Current value: Display / hide the column.
Display Average: Display / hide the column.
Display Minimum: Display / hide the column.
Display Maximum: Display / hide the column.
Display warning threshold: Display / hide the column.
Display critical threshold: Display / hide the column.
Display Hostgroups: Display / hide the column.
Display Hostcategories: Display / hide the column.
Display ServiceCategories: Display / hide the column.
Refresh Interval in seconds: Sets automatic refresh time for widgets.
Example