Organizing data in a report
About displaying and organizing report data
Interactive Viewer enables you to organize report data in several ways. You can change the width of columns, and move and remove columns to improve presentation or change the order of data in a report.
You can sort data in a column in ascending or descending order, organize data columns into groups, and create aggregate data values. You can create aggregate data, at the end of a customer group, for example, by displaying the total amount of a customer.s purchases or the average amount of each order. You can also create calculations, such as sums, standard deviations, rankings, and differences.
You can also use Interactive Viewer to change group and column headers, and to customize pagination in a multipage report by defining page breaks before or after groups. A group displays all the information about an item category in one place. For example, you can display all the information about one customer, then all the information about the next customer, and so on. You can display the information for customers and their orders by grouping the information by product, or you can display a company.s sales by geographical region.
You can hide columns, as well as report elements based on your needs. You can also hide duplicate data rows in a column, or a group. This document describes these tasks in more detail.
Modifying the width of a column
In addition to modifying the alignment and text properties of column data, you can optimize the layout of a report by adjusting the width of report columns according to the space occupied by column data.
For example, Figure 5-1 and Figure 5-2 show two reports. In Figure 5-1, the report uses the default column width. In Figure 5-2, the same report is modified to optimize its column width. As the example shows, the report in Figure 5-2 looks neater, and eliminates wasted space when you print, or export the content to other formats.
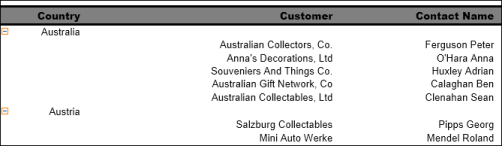
Figure 5-1: Viewing a report with the default column width
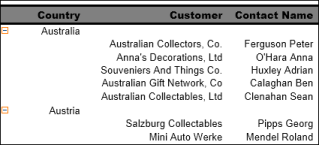
Figure 5-2: Viewing a report with the modified column width
How to modify column width
Select the column. Place the cursor on the right or left border of the highlighted column. Using the cursor, drag the border inwards or outwards to increase or decrease the width of the selected column.
Managing a column
This section describes how to use Interactive Viewer to change the order of columns in a report, delete report columns that are not necessary, hide existing columns, and display hidden columns. When you delete a column from the report, you cannot insert it back into the report design at a later time. If you might have a need for data in the column later on, you can hide the column, and display it whenever necessary.
How to reorder columns
You can move columns to change the order of columns in a report table in one of the following ways:
Choose the column to select it, then drag the column from its original location, and drop it in a new location, whose position is indicated by an arrow that appears on the top of the column label.
Choose Column > Move To Left from the context menu to move the column to the left of the previous column.
Choose Column > Move To Right from the context menu to move the column to the right of the column next to it.
Alternatively, complete the following steps to move a column:
Select the column. From the context menu on the column toolbar, choose Column > Reorder Columns. Arrange Columns appears, as shown in Figure 5-3.
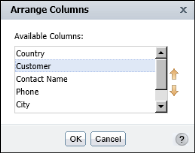
Figure 5-3: Arranging columns in Interactive Viewer
In Available Columns, select the column to move. Choose the up or down arrow on the right until the column is in the correct position. Moving a column up in the list, moves it to the left in the report. Moving a column down in the list, moves it to the right in the report. Choose OK.
How to remove one or more columns from the report
To remove a column, select the column and press Delete. You can also select the column, then choose Column.Delete Column from the context menu. To remove multiple columns, press Ctrl when selecting columns. Then, use the previously described method to delete the columns from the report.
How to hide a column
Select a column. From the context menu choose Column.Hide Column. Interactive Viewer displays the report without the selected column.
How to display a hidden column
Select a column. From the context menu, choose Column.Show Column. Show columns appears listing the hidden columns. In Pick Hidden Column, select the column to display. Choose OK. The column appears in the report.
Sorting data
Sorting data is an important task in creating a useful report. A customer phone list, for example, is easier to use if it is in alphabetical order. A sales report is more useful if it presents sales figures from highest to lowest, or the reverse, if you want to see lowest to highest performers.
You use sorting to display report content in a more meaningful order. For example, reports often display data in a seemingly random order depending on the report design. You can sort data in ascending or descending order, and you can sort by as many fields as needed. For example, you can sort a list of customers by credit rank, then by customer name.
Compare the reports in Figure 5-4. The report on the left displays data as in the original report. The report on the right displays the same data, sorted by country.
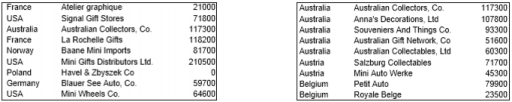
Figure 5-4: Comparing reports with sorted and unsorted data
You can sort data in ascending or descending order, and you can sort data by multiple columns. For example, you can sort the data in a report by country, and then by customer name. Figure 5-5 shows a sample of the results of this sort action. Countries appear in ascending alphabetical order. For each country, the customer names appear in alphabetical order.
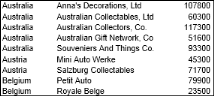
Figure 5-5: Customer names sorted in alphabetical order
Sorting on a single column
To sort data on a single column, select the column. Choose the appropriate arrows to Sort Ascending or Sort Descending from the column toolbar. You can also choose Sort.Sort Ascending or Sort Descending from the context menu.
Sorting on multiple columns
You can sort data by up to three columns. When you sort by multiple columns, you use the Advanced Sort option, shown in Figure 5-6. It is important to understand the order of precedence for a multiple sort action. On Advanced Sort, select the columns on which to sort, in the order in which you want to sort the data. For example, to sort data by country first, and then by customer name within each country, select the columns in that order on Advanced Sort.
How to sort data on multiple columns
- Select a column. From the context menu, choose Sort > Advanced Sort.
- On Advanced Sort, in Sort By, select a column from the list, then choose either Ascending or Descending, as shown in Figure 5-6.
- Select a second column from the next drop-down list. Choose the sort order. You can also select a third column on which to sort. Choose OK.

Figure 5-6: Sorting data on multiple columns
Sorting data in a merged column
When working with merged columns, if you choose Sort from the context menu, Select Data Item appears, as shown in Figure 5-7, providing a drop-down list of data items in the merged column.
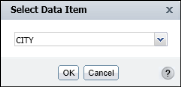
Figure 5-7: Selecting a data item
From the drop-down list, select the item on which to sort data. Choose OK.
You can now sort data in each of the columns, as described in the previous sections of this document. To modify each line of data in the merged column, you must repeat this step for each data item, then define the sort order, each time.
Reverting data to its original order
To revert data to its original unsorted order, select a column. From the context menu, choose Sort > Advanced Sort. On Advanced Sort, for each column specified for a sort action, choose Select a Column from the drop-down list. Choose OK.
Organizing data in groups
Sorting data makes a report more readable and useful. Sorting is typically only one of the tasks you perform when organizing data in a report. It is common for reports to present data that is organized into meaningful groups, especially reports that contain large amounts of data. Consider the task of listing every item a corporation owns, along with information such as the category, purchase price, purchase date, inventory code, location, and supplier. If a report presents all these items in an unorganized list or sorted list, it is not possible to determine how much the corporation spends, for example, on office furniture or computer hardware because this information cannot be easily calculated. The report cannot provide information such as which year had the most purchases, or which items are located in a field office and which items are in the warehouse.
To organize all this information into a useful inventory report, you create data groups. Data groups contain related data rows. For example, you can create a report that lists items by category.all office furniture in one group, all computer hardware in another group, all computer software in a third group, and so on. For each group, you can calculate aggregate data, such as the total purchase price or count of items in a group. Organizing data in groups makes it easier to compare and analyze information.
Compare the reports in Figure 5-8 and Figure 5-9. The report in Figure 5-8 displays customer information in a simple list. The data rows are sorted by country. Notice the repeated country names in the first column.
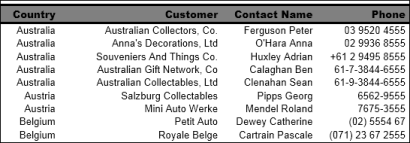
Figure 5-8: Report with data sorted by country
The report in Figure 5-9 shows the same data. Unlike the previous report, this report groups the rows by country, removing the repeated entries.
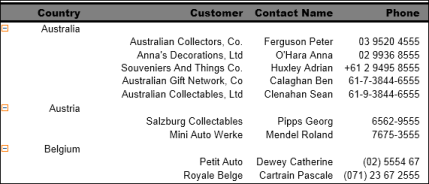
Figure 5-9: Report with data grouped by country
A report that groups data provides a more effective way to view data. When you group data, you can:
- Add subtotals, counts, averages, or other aggregate information at the beginning or end of each group.64 Working with Actuate BIRT Viewer.
- Insert a page break before or after each group to start each data group on a new page.
- Hide the details of each group to view a summary report.
In addition, Interactive Viewer performs the following actions when you group data: * Removes duplicate values for each group. * Sorts the values of each group. For example, a country group displays the countries in alphabetical order, as shown in Figure 5-9. * Generates a table of contents that displays the values of every group when you view the finished report in the viewers. The table of contents allows you to navigate to specific locations in the report. This feature is particularly useful when a report contains many pages.
How to group data
Select the column that contains the values to group. From the context menu choose Group > Add Group.
If the column you selected contains string or numeric data, Interactive Viewer groups the data by each unique value in the column. If the column you selected contains date-and-time data, additional grouping options appear.
Grouping data on a date-and-time column
When you group data on a date-and-time column, you have two options. You can show every individual date or time value, or you can group the data by a specific time interval, which is the typical option. You can organize a shipping report, for example, showing shipment data by month or by quarter, rather than by date.
Figure 5-10 shows three reports that contain the same data.
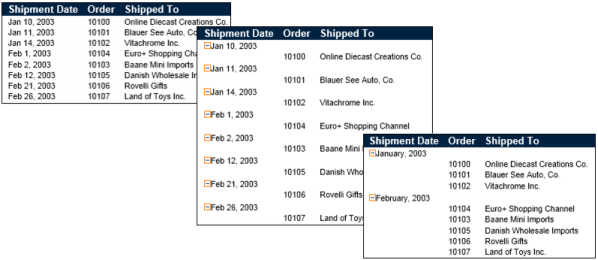
Figure 5-10 Comparing reports with grouped and ungrouped data
The report on the left displays data that has not been grouped, the second report groups shipment dates using individual date values, and the third report groups shipment dates by month.
How to group date-and-time data
- Select the column that contains the date-and-time data. From the context menu, choose Group.Add Group.
- On Group Detail, select one of the group options. If you opt to group by interval:
- Select an interval type, such as weeks, months, or quarters, from the drop-down list.
- Type a number to indicate the grouping for the selected interval type. For example, if you selected Weeks, type 2 to group data in two-week periods.
Figure 5-11 shows grouping the Shipped Date column by month.
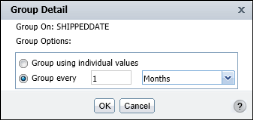
Figure 5-11 Grouping by shipping date
Grouping on multiple columns
When you group data on multiple columns, consider the order of precedence before you create the groups. To group customer data by state, then by city, create the groups in that order. The order in which grouped columns appear in a report indicates the order in which the groups were created. The first group appears as the leftmost column in the table, the second group appears next to it, and so on.
Changing the grouping order
After you create groups, you can change their order. Evaluate the effect of changing the grouping order. For example, changing the order of the state or province and city groups to city and state or province produces a report that organizes data illogically. On the other hand, changing the order of the sales office and product line groups to product line and sales office provides you with a different perspective on the sales data. The focus shifts from sales office performance to product line performance.
How to change the grouping order
Select a column. From the context menu, choose Column > Reorder Columns. Arrange Columns, as shown in Figure 5-12, shows the columns in the order in which the report currently displays the data.
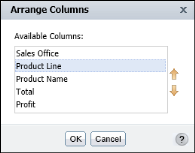
Figure 5-12 Reordering grouped columns
On Arrange Columns, select the grouped column from Available Columns. Use the up or down arrow buttons to move the column up or down the list. Choose OK.
Aggregating data
One of the useful features in a report is the ability to display summary, or aggregate, data. Many example reports in the previous sections of this document contain aggregate data. For example, a sales report can show the overall sales total; sales subtotals by product type, region, or sales representatives; average sales figures; or the highest and lowest sales figures.
Aggregating data involves performing a calculation on a set of values. For a simple listing report that does not organize data in groups, you can perform aggregate calculations on values in a selected column, across all the data rows in a table. For example, consider a report that has a column calculating price*quantity. You can use the sum of the calculations in this column to obtain the total price of all items. You can create up to three aggregations for each report column.
When you aggregate data, you choose whether the aggregation appears in the table header or footer. If the column is grouped, you can display the aggregate value in the group header or footer. The report in Figure 5-13 displays aggregate data for the Total and the Profit columns at the end, or footer, of the table.
When you aggregate data, you choose whether the aggregation appears in the table header or footer. If the column is grouped, you can display the aggregate value in the group header or footer. The report in Figure 5-13 displays aggregate data for the Total and the Profit columns at the end, or footer, of the table.
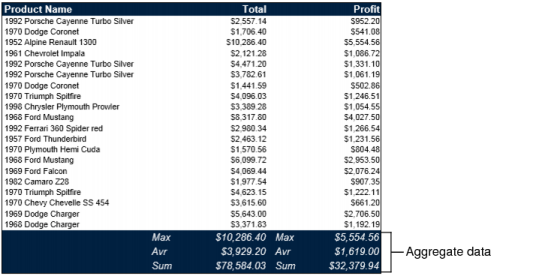
Figure 5-13 Report displaying aggregate data
In a report that organizes data into groups, you can display aggregate data for a selected column or columns. You can also perform aggregations for each group of data rows, and for all the data rows in the table. In the example report shown in Figure 5-14, the aggregate data appears at the footer of each group.
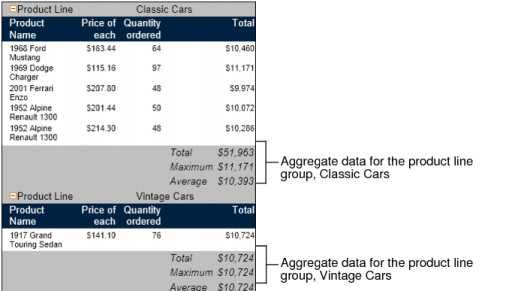
Figure 5-14 Aggregate data by product line group
Adding and removing an aggregate value
When you aggregate data in a column, you specify the following information:
- The type of aggregate calculation. The report in Figure 5-14 displays, for the Total column, the sum of the values, the highest (max) value, and the average value. Interactive Viewer supports other types of aggregate functions, described later in this document. Each aggregation appears on a separate row.
- Whether to perform the aggregate calculation across all the data rows in the table, or across the data rows in each group, or both. Aggregating data for groups applies only to reports that organize data in groups.
- Whether to display the aggregate data in the footer or header of the table or the groups. The previous examples show aggregate data in the footers, which is typical. Choose header to display the aggregate data at the beginning of the table or group.
How to aggregate data
- Select the column containing the data to aggregate. From the context menu, choose Aggregation. Aggregation appears. The syntax of the selected function appears in the lower part of Aggregation, as shown in Figure 5-15. From the Select Function menu, select the aggregate function to use.
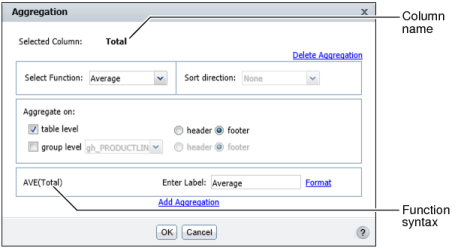
Figure 5-15 Aggregating the Total column as an average
- Specify a sort direction for the resulting aggregation. If you select Ascending or Descending from the Sort direction list, the groups appear, in ascending or descending order in the report. Select none if you do not want to sort the groups in any order.
- In Aggregate on:
- Select table level to aggregate data across all the rows in the table. Select either header or footer as the location in which to display the aggregate data.
- Select a group from the next list to aggregate data at the group level. Select either header or footer as the location in which to display the aggregate data.
- In Enter Label, enter a name for the label. Optionally, set a font for the aggregation label, by choosing Format.
- To create a second aggregation, choose Add Aggregation. In Select Function, select a function from the list. Repeat step 2 to step 4 to define the aggregation. Choose OK. Figure 5-16 shows two aggregations defined for the report.
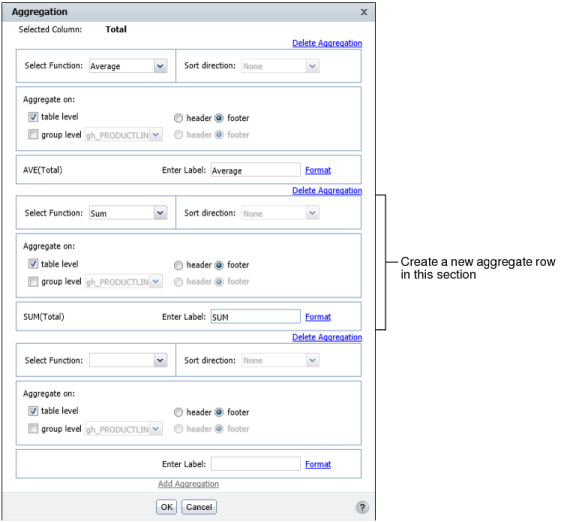
Figure 5-16 Adding an aggregate row for a column
How to add additional aggregate rows to a column
After you create a single aggregate value for a column, you can add up to two more aggregate values for the same column. For an order total column, for example, you can create a sum of all the values, count all the values, and get the average order total.
- To add an aggregate value, select a column that contains an aggregate value. Choose Aggregation from the context menu.
- On Aggregation, choose Add Aggregation. An additional section appears on Aggregation, shown in Figure 5-16.
- Create the second aggregate value and choose OK.
How to aggregate data in a merged column
- When working with merged columns, if you choose Aggregation from the context menu, Select Data Item appears.
- Select the data item or column on which to perform an aggregation, from the drop-down list. Choose OK.
You can now create aggregations for each of the columns, as described in the previous sections of this document. To modify each line of data in the merged column, you must repeat this step for each data item, then define the aggregation, each time.
How to delete an aggregate value
- Select the column that contains the aggregation to remove. From the context menu, choose Aggregation.
- Aggregation appears, displaying all the aggregations for the column. Choose Delete Aggregation for the aggregation you want to remove. Choose OK.
Types of aggregate calculations
The aggregate calculations you can perform on a column depend on the type of data in the column. You can perform functions only on numeric data, that enable a mathematical calculation, such as SUM and AVERAGE.
The most common aggregate functions used for string data are Count and Count Value. Count returns the number of values in a column, including duplicate values. Count Value returns the number of distinct values in the column. You can use Count Value, for example, on a customer name column to get a count of the number of customers.
For date-and-time data, you can use the MIN and MAX functions to get the earliest and the latest date, respectively, from an order date column.
For a description of the aggregate functions available, see the chapter Functions and operators.
Hiding and displaying report elements
This section describes how to use Interactive Viewer to hide or display elements in a report, such as a column or table header, a report table, a chart, and an image in the report.
How to hide or display report items
- Choose Hide/Show Items from the main menu. Hide or Show Items appears, as shown in Figure 5-17.
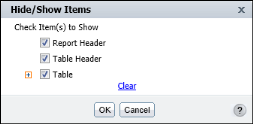
Figure 5-17 Hiding or displaying report items
- Select the items to display. Deselect the items to hide. To hide all items, choose Clear. Then, choose OK.
Hiding group details
In a report containing multiple groups, it is sometimes useful to hide the details for a specific group if you do not want to display all the information at the same time. For example, in a sales report that groups orders by state and product, you can display only the state totals, by choosing the top-level group, state, and then selecting the Hide Detail option. Hiding the details from the state group recursively hides all data within the state group; the report hides product groups and the order details within each product group.
When you work with a report that organizes data in groups, you can change the report to a summary report by hiding the group details. Hiding details, particularly for a report that runs into hundreds of pages, helps you display key information at a glance.
Figure 5-18 shows two reports that contain the same data. The report on the left shows all details. The report on the right hides the details within each product line group.
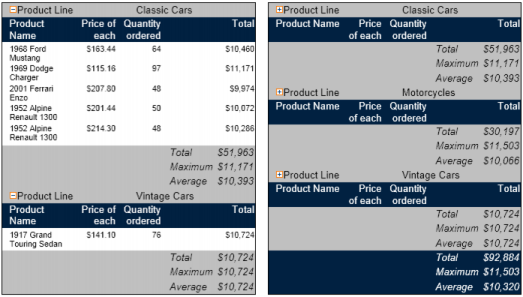
Figure 5-18 Comparing reports showing and hiding product details
How to hide group details
Select the grouped column whose details you want to hide. From the context menu, choose Group > Hide Detail*.
How to redisplay group details
Select the grouped column, then from the context menu choose Group > Show Detail.
Suppressing duplicate values
Frequently, you find that you do not need to display all the data present in a report. For example, sometimes a report column displays duplicate values in consecutive data rows. When the duplication is unnecessary or makes the report difficult to read, you can suppress consecutive duplicate values. In addition, as you modify a report, you can collapse groups to display only the column headings and summary data, such as aggregate data rows.
You can also use Interactive Viewer to suppress duplicate values that appear in a grouped column. For example, a report that lists customer orders, grouped by customer, shows some data values such as the address, contact information, customer number, and so on, multiple times for every order placed by the customer. You can prevent the duplicate occurrence of these values by moving data rows from the column to the group header.
Avoiding repeated values in a column
In the report shown in Figure 5-19, the Location column shows the city name each time the name occurs.
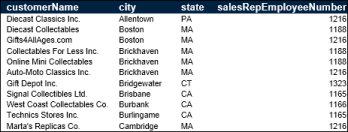
Figure 5-19 Duplicate values in columns
As Figure 5-20 shows, the report appears neater and more organized when duplicate values are not repeated.
Using Interactive Viewer, you can suppress consecutive occurrences of duplicate values. In the Location column in Figure 5-20, the Boston value is suppressed in the second, third, fourth, and fifth rows. If Boston occurs again after the listing for NYC, that occurrence of Boston is visible and subsequent consecutive occurrences are suppressed. The values must be exact duplicates to be suppressed.
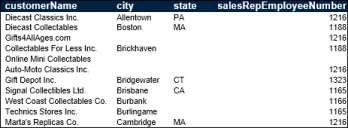
Figure 5-20 A report suppressing duplicate values
If a column extends across multiple pages, the first row on each page displays a value, even if duplicate values are suppressed for that column.
How to suppress duplicate values in a column
Select the column containing duplicate values. From the context menu, choose Column > Do Not Repeat Values.
How to show hidden duplicate values in a column
Select a column that does not repeat duplicate values. From the context menu, choose Column > Repeat Values.
Avoiding repeated values in a group
The example report in Figure 5-21 displays the values for Customer Number, E-mail, and Credit Limit multiple times for the same customer. By moving the data row values to the group header, you limit the appearance of these fields of data so that they only appear once.
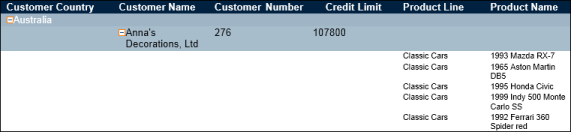
Figure 5-21 A report displaying duplicate values in a group
How to suppress duplicate values in a grouped column
- Select the column with the duplicate values. From the context menu, choose Column > Move to Group Header.
- On Move to Group Header, as shown in Figure 5-22, perform the following tasks:
- Select the group to which you want to move the data values, if the report contains more than one group.
- Select the header row to which Interactive Viewer can move the data values.
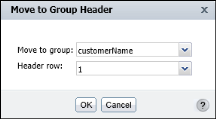
Figure 5-22 Selecting a group header
Repeat this step for each report column for which you want to move data rows to the group header. Choose OK. The value from the first data row in each group appears in each group header. The Credit Limit, E-mail, and Customer Number columns display a single data row for each Customer Name group header, as shown in Figure 5-23.
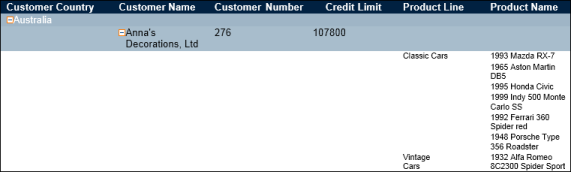
Figure 5-23 Displaying a report showing suppressed duplicate values