Modifying summary tables
About summary tables
A summary table presents aggregate or summary information in a report, providing users with a concise view of the data at a glance. The aggregate information displayed in a summary table is typically displayed in the table header or footer, or the group or section header or footer in a detail BIRT report. A summary table is particularly useful when a user needs to work with large volumes of data, because the calculations are made at the data source level, making only the computed data visible to the user. Report developers can create a summary table using BIRT Report Designer by simply selecting the relevant data fields in the correct order, and inserting them into the report design. A summary-table report can provide users with information such as sales by territory, or sales by employee, or sales by employee, by territory.
Although hiding details for a group in a detail table can achieve the same presentation of aggregate information as a summary table, improved performance and reduced server load are a few unique benefits of using a summary table over hiding the details in a detail table.
You can use Interactive Viewer to edit and format data in a summary table, organize data columns, create filters for column data, and save a modified summary table. In addition, you can use both viewers to export a summary table, export data in a summary table to supported flat file formats, display a table of contents, and print a summary table.
About columns in a summary table
The columns in a summary table are classified into dimension columns, attribute columns, and measure columns. The columns used to group data in other columns are dimension columns, and the columns whose aggregated values are evaluated are measure columns.
A dimension column groups data in other columns. Dimension columns are typically not aggregated. Some examples of dimension columns include order date, country, state, product line, and so on. A measure column is typically ungrouped, and contains aggregated data. Some examples of measure columns include number of orders, quantity ordered, profit, revenue, and so on. Sometimes a summary table can contain additional columns called attribute columns. Attribute columns are typically associated with a dimension column. For example, Product Code can be an attribute of the Product Line dimension.
Dimension columns are always displayed to the left in a report design. In the example, as shown in Figure 10-1, Order Date is a higher level or outer dimension group, and Country is another dimension group that contains the associated attribute Customer City. Dimension columns and their associated attribute columns are typically displayed side-by-side in a summary table. The example also displays a third dimension column, Order Status.
A grouped dimension column displays subtotals for the data in each group. A grouped dimension column does not display duplicate data values allowing for accurately calculated aggregate data.
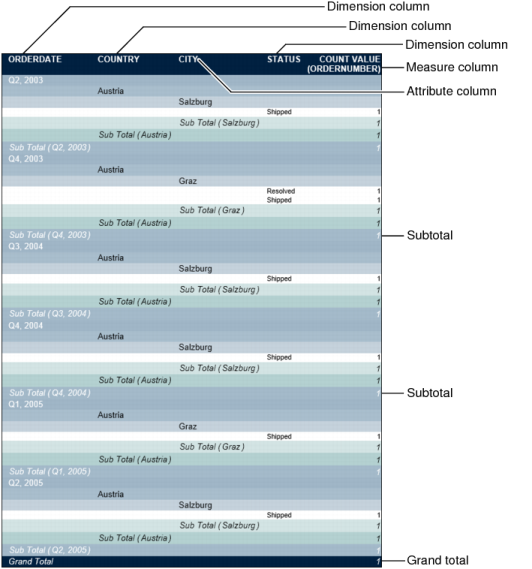
Figure 10-1 A summary table
The following section describes how you can modify data in a summary table.
About modification options
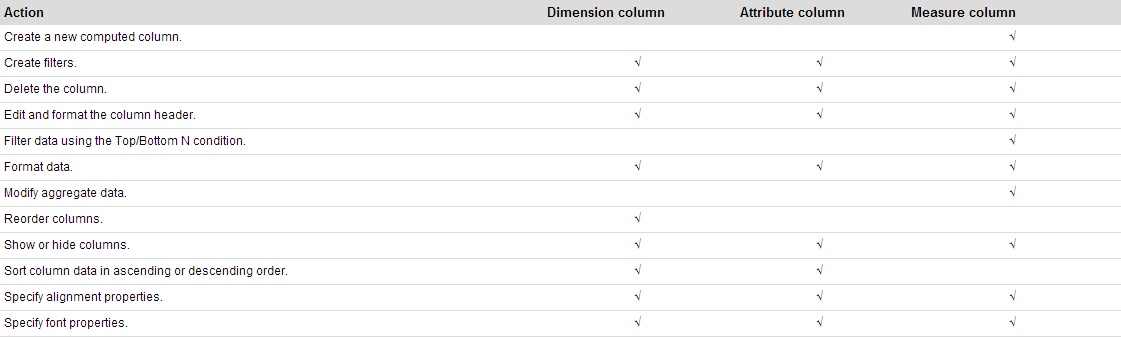
In Interactive Viewer, you can modify summary tables by editing and formatting data, creating filters to display specific data, inserting calculations in a summary table, and so on. Table 10-1 compares the actions you can perform on dimension columns, attribute columns, and measure columns.
Table 10-1 Modification options for data in a summary table
Editing and formatting summary-table data
In Interactive Viewer, you can modify the appearance of the data in a summary table to edit and format column headers, column data, and font and alignment properties. You can also modify font properties and format aggregate data values.
How to format the column header
Select the column to highlight it, then select Header > Change Text, Header > Alignment > Left, Center, or Right, or Header > Font from the context menu, shown in Figure 10-2.
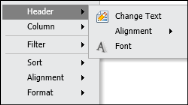
Figure 10-2 Modifying a column header
How to format column data
Select the column to highlight it, then choose Format.Font or Format.Format Data from the context menu.
How to format aggregate data values
Select the Subtotal or Grand Total value, and choose Format.Font or Format.Format Data from the context menu.
Organizing data in a summary table
You can organize data in a report by sorting column data, showing or hiding columns and report elements, and moving or deleting a column.
Sorting data
You can sort data in dimension columns, or attribute columns in a summary table, in descending order. A grouped column automatically sorts data in ascending order. To modify the sort order, select the column, and choose Sort > Sort Descending from the context menu.
Showing and hiding columns in a report
You can hide or show dimension columns, attribute columns, and measure columns in a summary table.
Select a column to highlight it, then select Column > Show Column from the context menu to display the column in the report.
Select a column to highlight it, then select Column > Hide Column from the context menu to hide the column that you do not want to display in the report.
Moving and deleting a column
In Interactive Viewer, you can move an attribute or measure column, but cannot move a dimension column in a summary table. You can delete a dimension column, an attribute column, or a measure column. You can move attribute columns among other attribute columns in a summary table. When you move a measure column in a summary table, you can move it only within the other measure columns.
To move a measure column, select the column and choose Column > Move to Left from the context menu.
To delete a column, select the column and choose Column > Delete Column from the context menu.
Creating a computed column in a summary table
You can create a computed column for data in measure columns, as you would do for a regular report column. You can also edit an existing computed column in a summary table. You cannot create computed columns for data in dimension columns.
Modifying a chart in a summary table
You can modify a chart in a summary table, in the same way you perform this task in a detail table. You can modify the subtype, formatting options, and export the chart to other formats.