Navigate a report
Launching the report
To launch a report with the Interactive viewer, go to the menu Reporting > Business Intelligence > Interactive view then select a report design.
The report designs are classified in two ways :
- By type of statistic reported:
- Availability
- Capacity
- etc...
- By type of input object that defines the precision of the report:
- hostgroups summary report : compares statistics from several host groups
- hostgroup report : detailed statistics for one host group
- host report : detailed statistics for one host
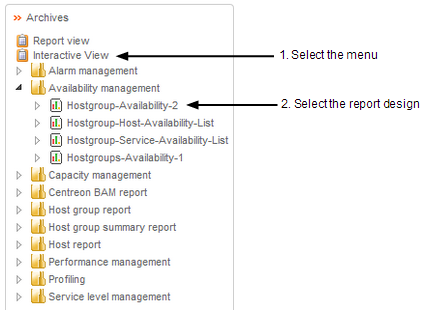
Figure 2-1: launch the report
Displaying parameter values
A parameter value is a way of limiting the report data retrieved when you run a report.
For example, in a report that displays a host group information, you can use parameter values to display avalability statistics for a specific group and also specify a reporting period.
If a report requires to enter parameter values, you are prompted to type the value when you generate the report as shown in Figure 2-2. Specifying parameter values enables you to navigate a report more effectively, and display only the information you need.
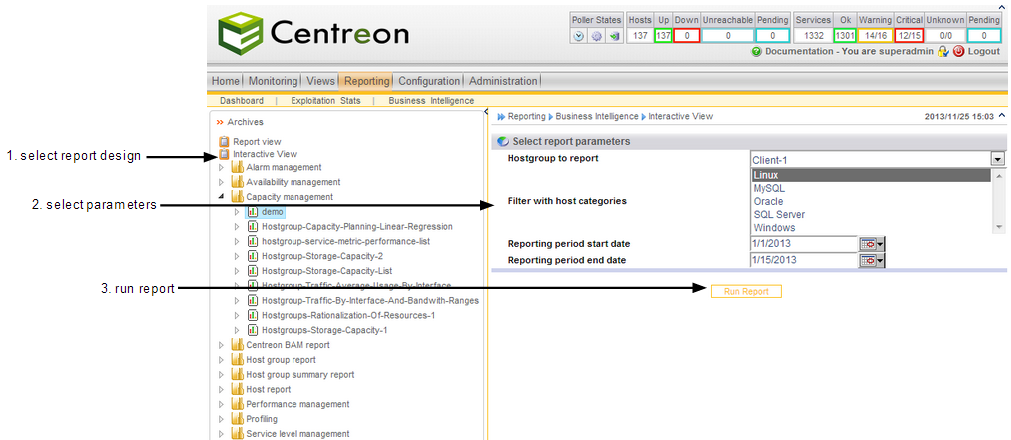
Figure 2-2: display parameters
If the report requires you to enter parameter values to determine what data to display, you can modify these values to view other data directly in the interactive view window, by clicking on the report refresh button as show in figure 2-3.
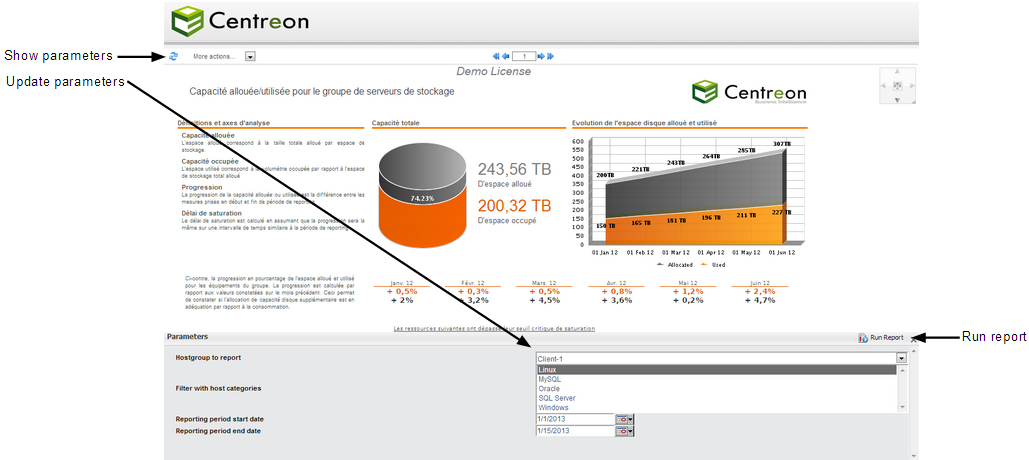
Figure 2-3: refresh parameters
Paging through a report
The viewer toolbar consists of a main menu with additional options, a parameters refresh button and a page navigation tool, as shown in Figure 2-4. You can view pages in a multipage report using the paging tool. The tool consists of a set of arrows that enable users to view the first or last page in a report, and to move forward or backward, page by page, through the report.
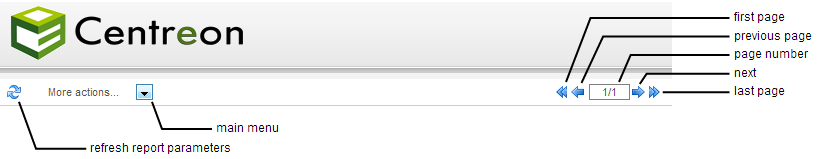
Figure 2-4: main toolbar
Saving a report
Many of the tasks you can perform in Interactive Viewer, such as sorting data, using conditional formatting, creating aggregate data, and inserting computed columns, are similar to tasks a report developer performs in the report design environment. Sometimes you need to modify the report and save it, so you can use it later, or make it available for other users to view and modify.
Two saving options are available in the main menu More actions... of the interactive viewer:
- Save design as: you can edit but not overwrite reports provided in standard with Centreon BI or owned by other users. But you can save a copy of these reports that integrates your modifications. In that case, you will be the owner of the new report and all Centreon BI specific properties related to the initial report design (report design groups, ACL rules) will be copied in the new one (see Figure 2-5).
- Save design: you can update and overwrite a report design that you are the owner.
Remark: The report designs edited and saved with these options are for the interactive viewer usage purpose only.
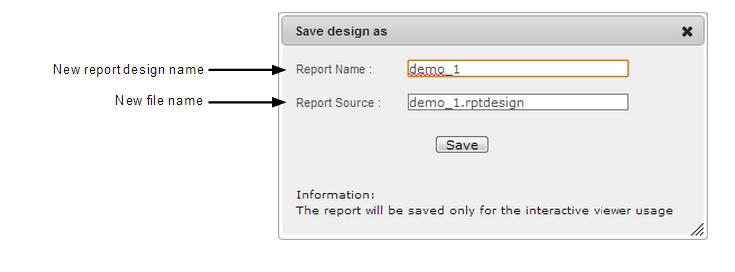
Figure 2-5: save design as
Export a report
After viewing a report, you can print it in HTML or PDF format. In Interactive Viewer, you can print either the original report or the modified report. You can print a maximum of 200 pages. From the main menu, choose Print then complete the following tasks:
In Format, select HTML or PDF. * If you select HTML, the report is formatted for printing as a continuous document in the browser window. Any page headers and footers appear in the body of the document, often multiple times, depending on how many pages the report contains. A multipage report does not retain its pagination properties when you choose to print it in HTML format. * If you select PDF, you can specify page style options for a multipage report. Select a page format from the list, as shown in Figure 2-6.
Auto is the default option. When you choose Auto, Interactive Viewer lays out the data such that the report content fits the width of the PDF page. If the report uses headers and footers, each header and footer are displayed in the appropriate location. Because the content is optimized in terms of font, and space, a single page in the report often displays on multiple pages in the PDF file. When you use the Auto option, existing pagination properties in the report are not retained in the PDF file, but the PDF output is paginated.
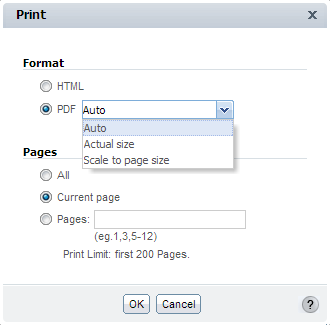
Figure 2-6: Print report
Choosing Actual Size retains existing pagination properties from the original report. When you choose this option, the font size in the printed report is often significantly smaller than in the original report, to allow the content to fit within specified page boundaries. After you send the document to a printer, further modify options on the printer dialog box as needed, so that the printed report is legible.
Choosing Scale to page size retains the existing pagination properties from the original report in the PDF output. Interactive Viewer shrinks report content such as fonts, and images, to fit each current report page on each page in the PDF output.
- In Pages, indicate which pages to print. You can print all the pages in the report, only the current page, or a specific set of pages. To print specific pages, use commas to separate the page numbers. To print a range of pages, enter the start and end page, separating the two entries with a hyphen. To print from a specific page to the end of the document, enter the start page followed by a hyphen. Choose OK.
Depending on your format selection in Print, you have the following options:
- If you selected HTML format, Print appears. Specify your printer options on Print.
- If you selected PDF format, the report appears in your web browser using a PDF viewer plug-in. You can preview the report, then choose Print to specify printer options. Review the options on the printer dialog box to make sure that the report content is legible.
Your report is sent to the printer you specify.
Export report content
You can export an entire report, as well as each individual report element, such as a chart, summary table, or cross tab, to several different formats (see Figure 2-7). Exporting content to one of these formats creates a file that can be used by applications other than the viewers. You can export report content to the following file formats:
Advanced Function Printing (.afp)
Microsoft Excel (.xls)
Microsoft Excel (.xlsx)
PDF (.pdf)
PostScript (.ps)
Microsoft Word (.doc)
Microsoft Word (.docx)
Microsoft PowerPoint (.ppt)
Microsoft PowerPoint (.pptx)
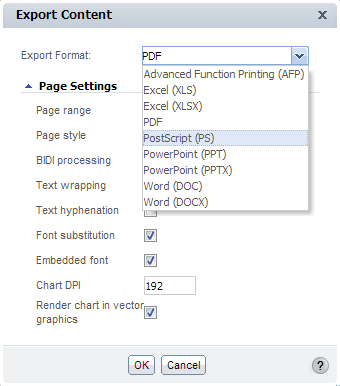
Figure 2-7: Export report content