Widgets
Widgets are available in the Palette part, on the top
Here is a list and a description of all the widgets available in Centreon Map 4:
Graph
A graph is based on a service and display all the perf data related to this service. You can specify many parameters (the number of points you want to display, stack lines, fill lines...).
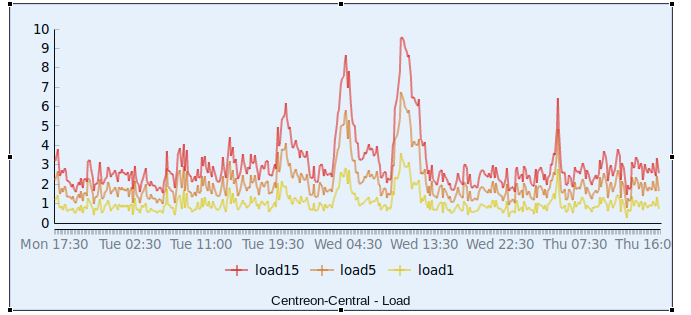
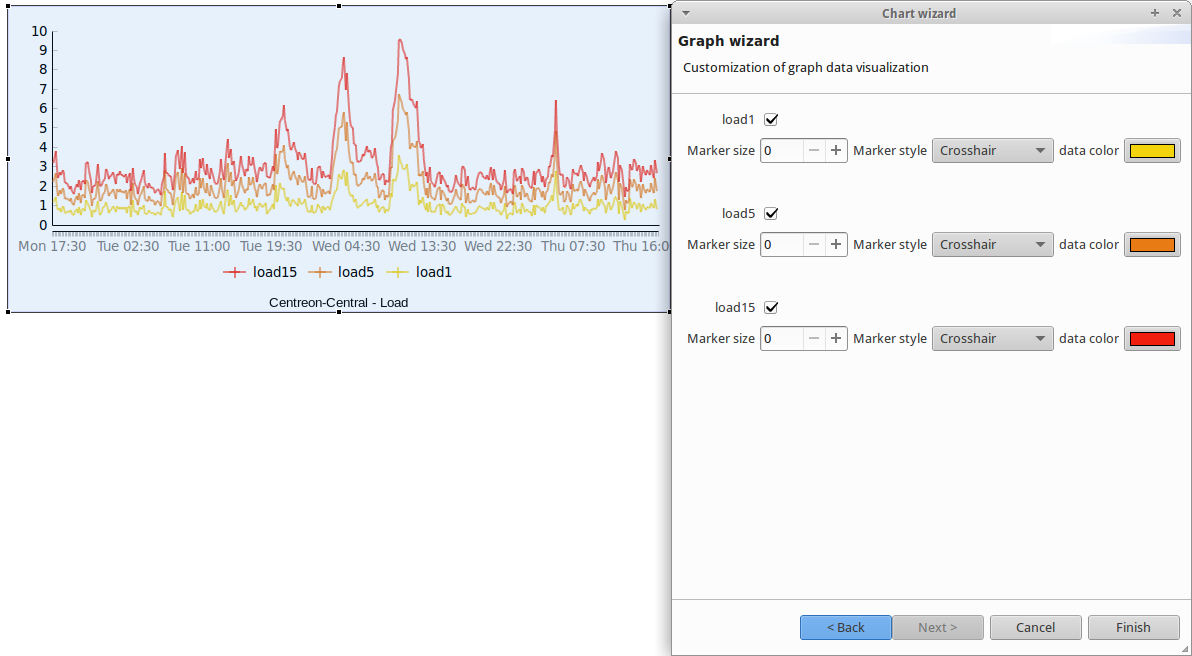
Once the graph is created, you can edit it and access a new configuration page were you can select which lines you want to display, it’s color and so on.
Gauge
The gauge displays the percentage of a metric. To create it you need to select a service and, on the next page, choose the metric you want to display.
Warning
In order to display the percentage of a metric, it must have a min and a max value defined. Otherwise it’s impossible to compute the percentage.
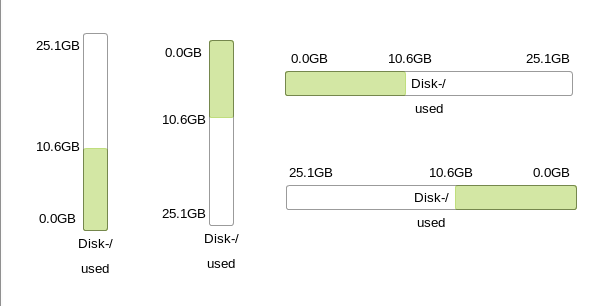
You can create gauge in every positions (left to right, bottom to top...). By default, the color of the gauge is associated with the status of the service.
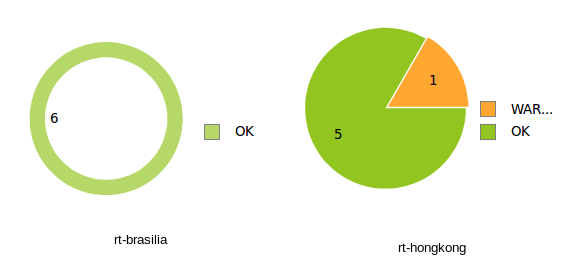
Piechart
Piecharts display the repartition of statuses of an host, hostgroup or servicegroup.
For a host, it will display the number of statuses Ok, Warning, Critical and NA. For a hostgroup it will display the number of host in state Ok, Warning, Critical and NA.
Output
Default behaviour
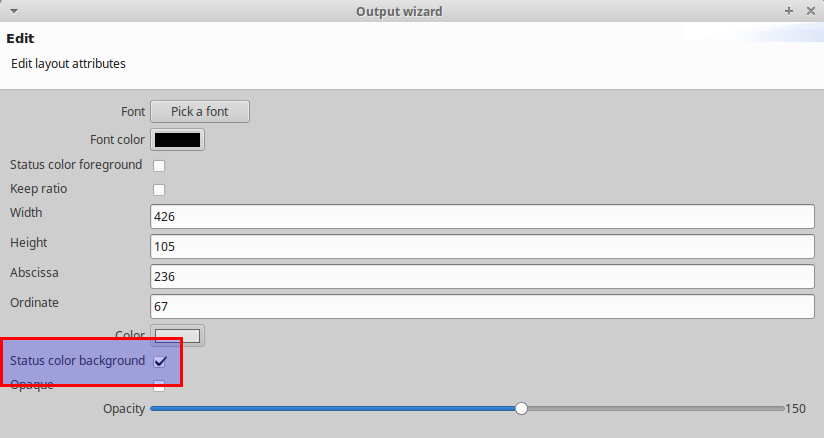
The output widget displays basically the output of a service.
By default, the background is the same color as the status. However, you can edit it by double-clicking on the output and modifing the checkbox Status color background.
Customize the output
You can customize the output with properties from your service and its metrics. To do so, edit the output (by double-clicking on it) then click twice on the Next button.
You will reach this page:
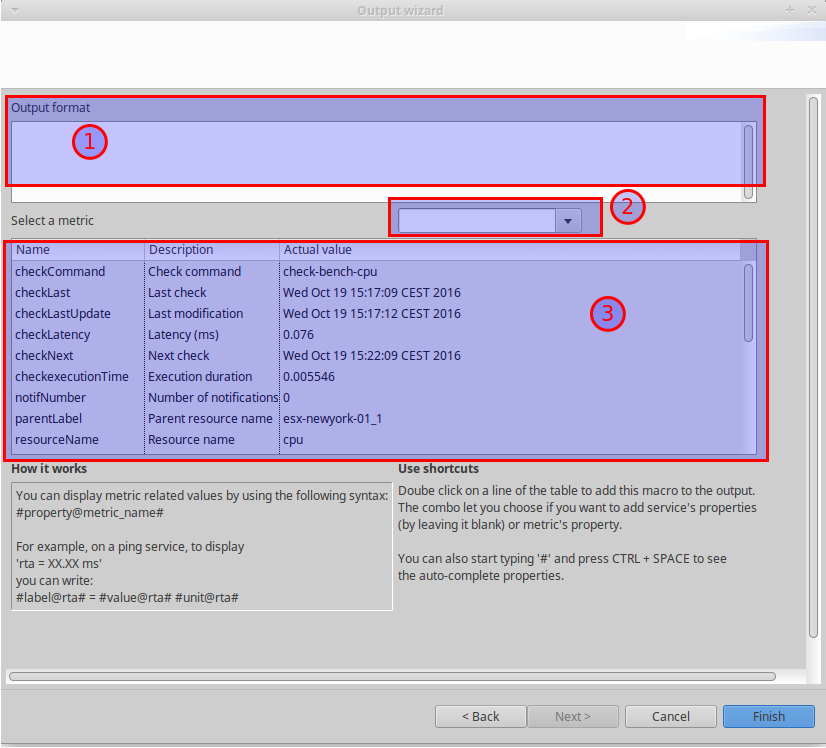
From there you can compose your output by using the properties listed in the table (3). Double clic on a line in the table and it will be inserted in the output.
By default, the properties listed belongs to the service. If you want to add properties linked to a metric (such as the metric’s value, min, max...) select the metric you want to use with the combo (2). The table (3) will then display the metric’s properties you can use.
Note
On the creation of a new output, the column Actual value might not be filled. However, as soon as you will clic the finish button, these properties will be filled. If you edit the output widget you will see them
Example
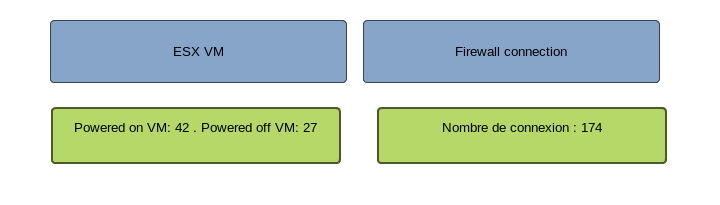
Lets’ say we want to display the number of users connected to a VPN and display the name of the VPN. The service we want to use has one metric called “clients” that represent the number of users connected.
To display the following output :
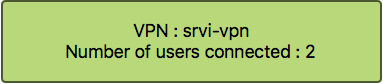
We have configured the output widget as follow :
VPN : #parentLabel#
Number of users connected : #currentValue@clients#
URL
The URL widget is associated with an URL. When you double click on it, it will open the URL.
For instance, if the URL points to a helpdesk platform, when you double click on it the helpdesk webpage will be opened in your default web browser.
The main goal of this widget is to be used in Map 4 web client. It allows you to create shortcuts to other views. If you want to create a shortcut from a container A to a container B, go into the container B, copy the URL of the page, create an URL widget on the container A and paste the URL previously copied.
Now, on the container A, you can double click on the URL widget and you will be redirected to the container B.
Process
This widget can be used to trigger an action on any resources based on a command.
Let’s take an example :
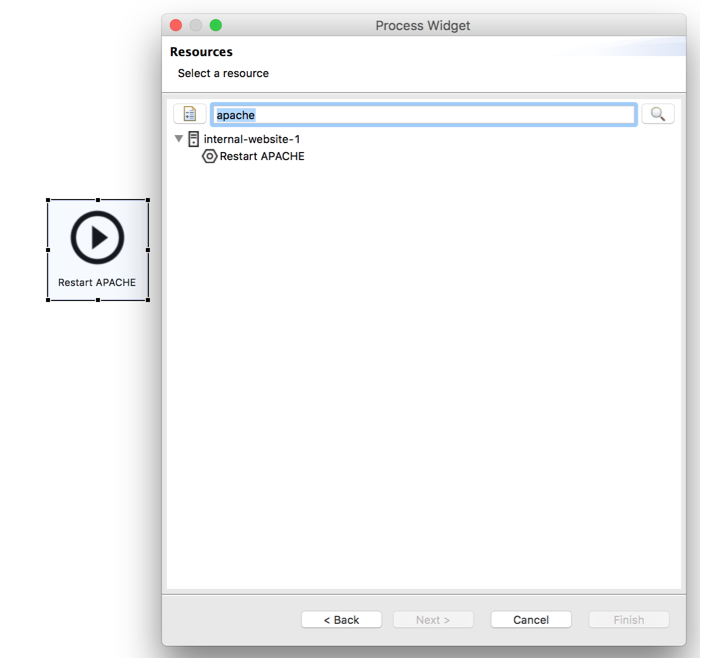
You have an internal website that uses apache and sometimes apache crashes. Your engineering team is investigating on the core problem “why apache crashes”, but now, what’s important for you is to ensure that final users can access the website. To do so, you can use the process widget and assign a command like “services httpd restart” so that when the process apache crashes, you can immediately restart the Apache service from the view by double clicking on the widget.
When creating the process widget, you’ll have to choose a service
To create a service dedicated to an “action” :
- Create a command (Configuration > Command > Add) that contains “service httpd restart” (don’t forget to enable shell)
- Link that command to a passive service
- Link that passive service to a host (for instance the host that hosts the website)
Then you’ll be able to assign that service to the widget.