Report Items
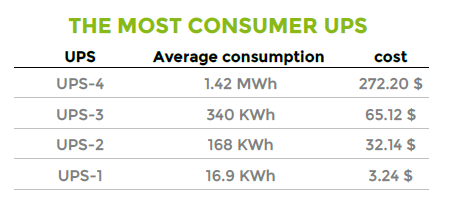
L2_12002_power-consumption-by-ups-Table
Description: Table displaying the most consumer UPS
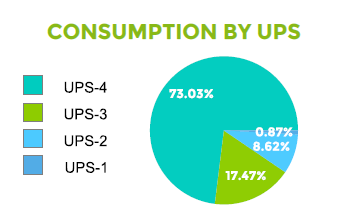
L2_12002_power-consumption-distribution-by-ups-Pie
Description: Pie displaying the consumption repartition by UPS
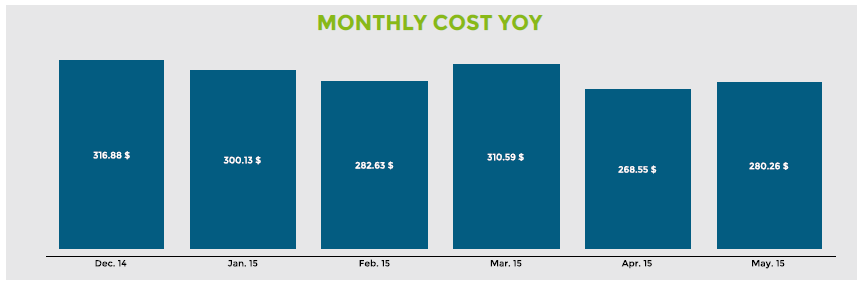
L2_122000-cunsommation-evolution-by-month-graph
Description: Graph displaying the monthly cost YoY
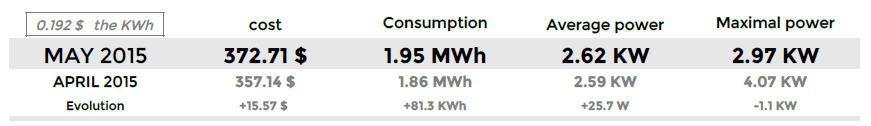
L2_122002_consommation_N-Nm1-table
Description: table displays the cost, the consumption, the average power and the maximal power reached on the month. A reminder of these values on the previous month and the evolution.
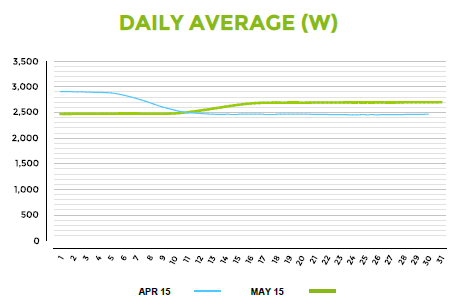
L2_122002_power-distribution-by-day-graph
Description: graphs diplay the average power used per day of month and a comparaison with the previous month
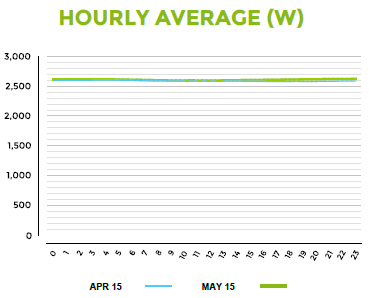
L2_122002_power-distribution-by-hour-graph
Description: graphs diplay the average power used per hour of day and a comparaison with the previous month