Availability & events
The availability and event data correspond to the data related to the hosts and the services states changes. They are used in the report templates and in the events and availability widgets included in Centreon MBI.
No prerequisites are required for reports using these concepts to be functional. All you need is a plugin that returns a status. In order for you to exploit and analyze what these reports present, it is important that you understand certain notions and rules of calculations.
Availability
Hosts
A host is considered available when its state is “Up”.
The availability rate calculation is as follow : “Up” duration / (“Up” + “Down” durations).
Additional rules :
The time spent in the “Unreachable” state is not taken into account in the calculation of the availability,
The time spent in “Downtime” is not taken into account in the calculation of availability.
Example : For a report on 1 day, if a host is available 23 hours and unavailable 1 hours on the theoretical 24 hours, its availability will be 23h / (23 + 1) ~ 95.8%.
Services
A service is considered available when its state is “OK” or “Warning”.
The availability rate calculation is as follow : (“OK” + “Warning” durations) / (“OK” + “Warning” + “Critical” durations).
Additional rules :
The time spent in the “Unknown” state is not taken into account in the calculation of the availability,
The time spent in “Downtime” is not taken into account in the calculation of availability.
Events
Only validated events are taken into account in the calculation of events. This corresponds to the “HARD” state in Centreon.
In the reports, different notions are displayed when we talk about events, they can be :
Exception : This corresponds to a “Down” state for a host and a “Critical” state for a service,
Warning : This corresponds to a “Warning” state for the services, there is no equivalent for the hosts,
Information : any other state.
An event on a host or service will be characterized by 3 things: :
A start date,
A end date,
A state.
Additional indicators
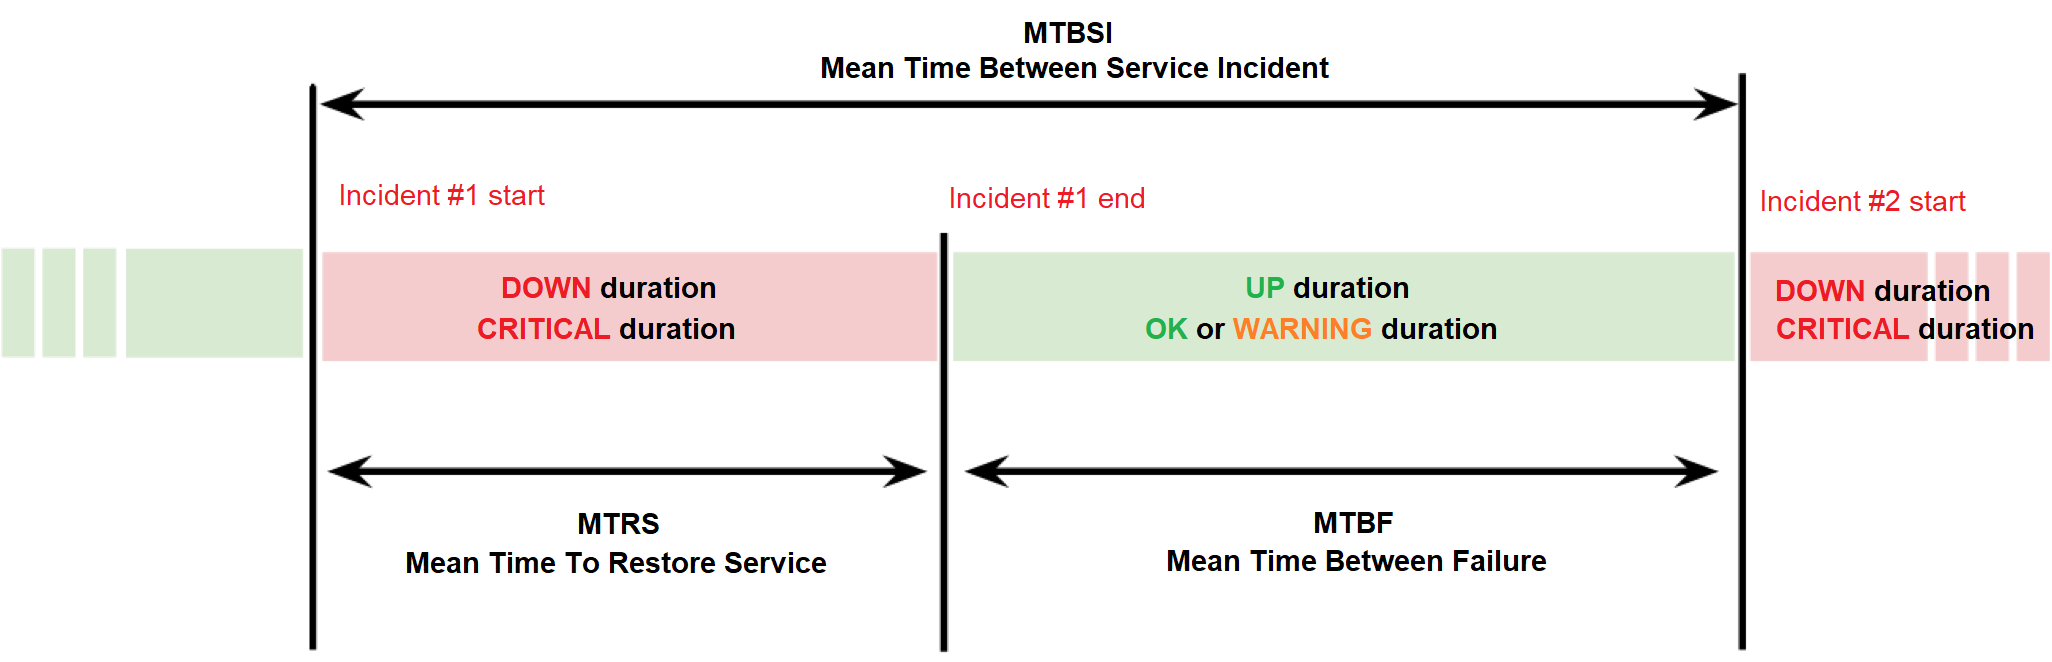
MTRS (Mean Time To Restore Service) corresponds to the maintainability : this is the average duration of the breakdowns. This indicator should be as low as possible.
MTBF (Mean Time Between Failure) corresponds to the reliability : this is the average time between the end of an incident and the beginning of the next. This indicator should be as high as possible.
MTBSI (Mean Time Between Service Incident) : this is the average time between the beginning of two incidents. This indicator should be as high as possible.
The diagram below shows the scope of these indicators :