BIRT Concepts
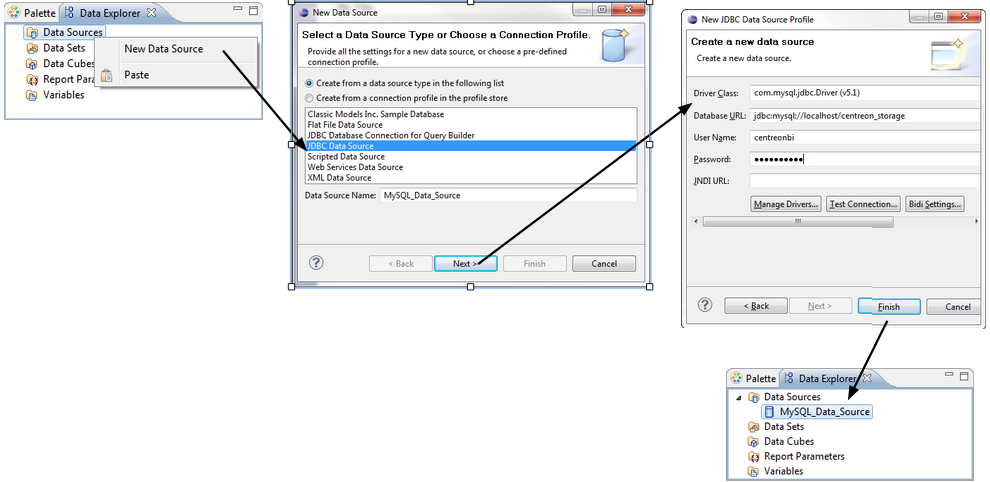
Data sources
In order to design a single report, you may need to connect to several data sources stored in different storage systems and accessible via different protocols:
Flat files (CSV)
JDBC data sources (MySQL, …)
XML documents
Web services
BIRT also allows you to script your own data source, accessing data via Java or Javascript objects.
However, it’s highly recommended to collect, consolidate and store reporting data in a single type data source (MySQL data source for example). Multiplying your data sources in a report will generate performance and maintenance issues.
Use a maximum of 2 types of data sources in the same report project (for example : JDBC and CSV).
Configuration of a data source:
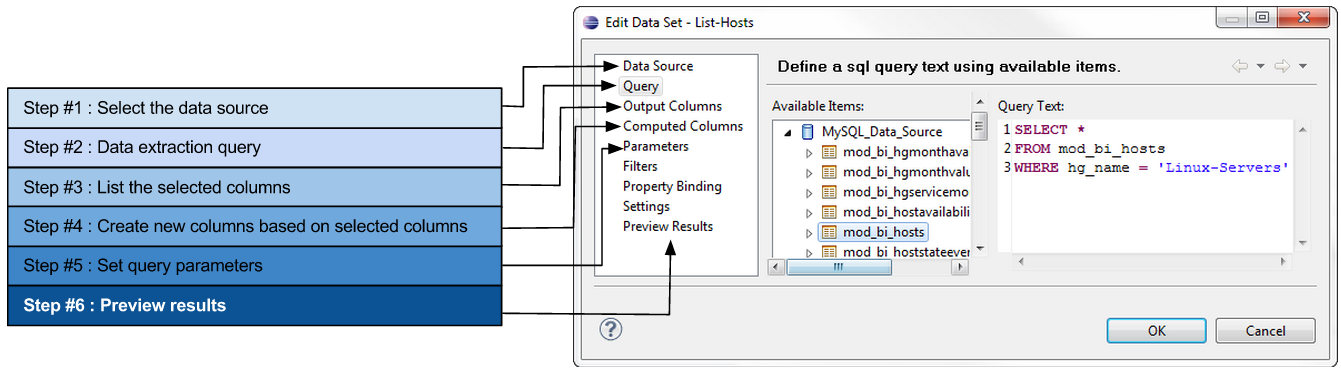
Data sets
You may want to extract a sample of data from an application database or a large CSV file. The BIRT “data set” allows you to write queries or select specific data from simple or complex data sources.
The different data sets defined in a report will contain all the available data to report using tables, charts, etc….
Data binding
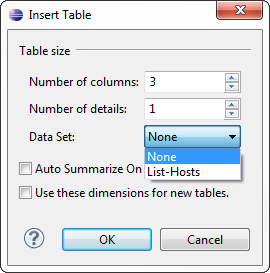
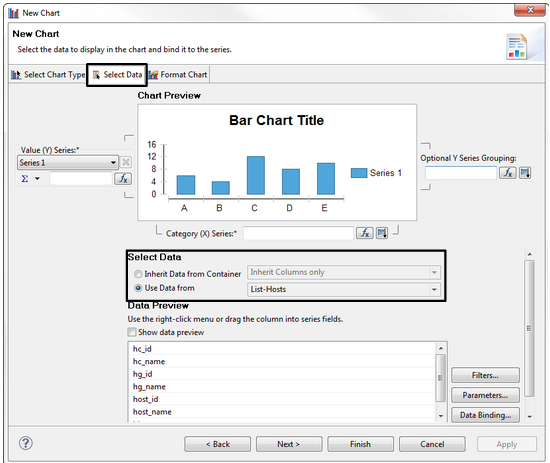
Once the data set is created, the selected data must be formatted in the report. To obtain a graph or a table populated with data, you will need to perform a “data binding” between a data set and a graphic component such as a table or a chart.
The data binding will copy the structure of the data set in the configuration of the graphical component. The complete structure (columns) of a data set doesn’t need to be copied to the layout component. Only the needed columns can be selected (best practice).
The data binding is set at the creation of a table or a chart:
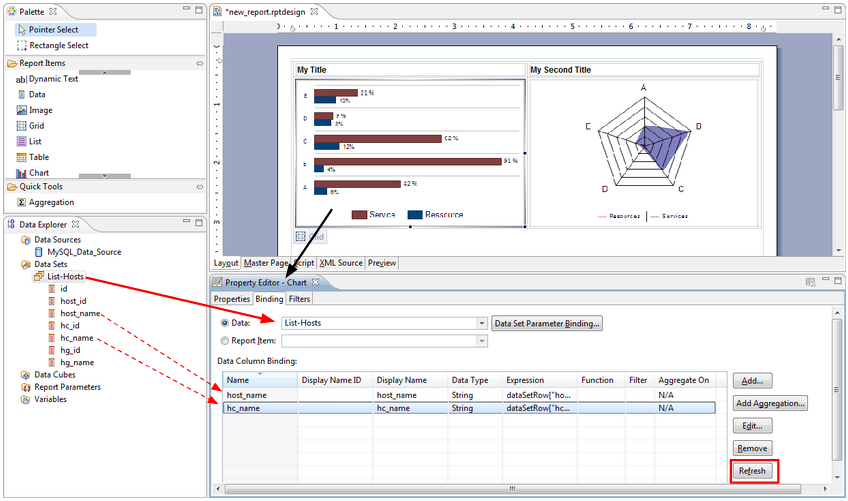
If the structure of the data set is modified and you need to apply this modification in your layout component (for example: retrieval of a new column in the data set that must be used in your previously created chart), you will need to use the property editor of your table or chart component to update the binding:
Report parameters
The report parameters are global variables set before the report generation. The main usage of report parameters is to avoid static values defined in the report. Example:
If the report must be generated for a specific period, this period could be defined with two parameters (which types would be “Date Time”) identifying the period start and the period end dates
If the report is generated for a specific host group, this host group can be specified by a report parameter
Using report parameter will also allow to use the same report design to display different statistics depending on the reporting parameters. Example: the same Centreon Availability report could be generated for different host groups and for different reporting periods.
For more details, see the chapter Report parameters
Layout the report
Grid
The grid component is mainly used to organize the report elements
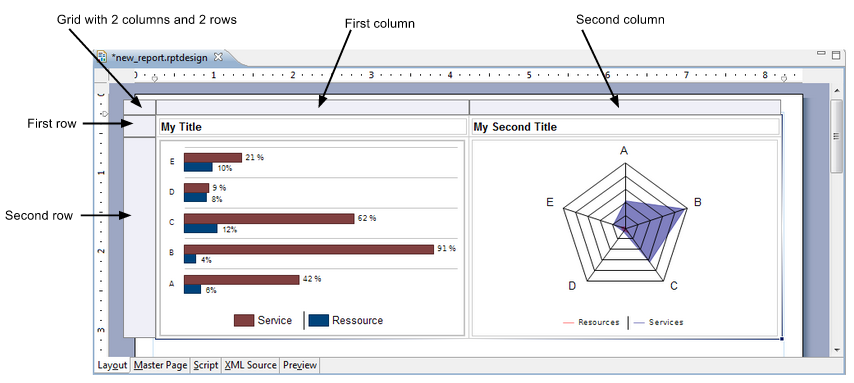
Best practice: Each component of a report (chart, table, label, text, etc…) must be inserted in a cell of a grid.
Table
The table is used to display dynamic content in a row and column format. The values of a table vary depending on the data set used for the data binding.
Structure of a table
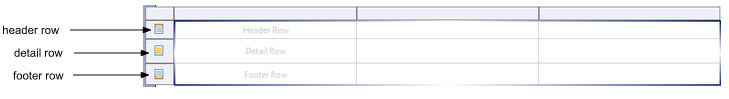
Header: displays the column title or a dynamic summary information calculate according to the listed values in the detail rows. The header row can be repeated at the beginning of each section if the table is displayed in several pages.
Detail row: a new detail row will be created to display each row from the linked data set.
Footer: Summary information such as total, average values from the detail rows can be displayed once in the last line of the table.
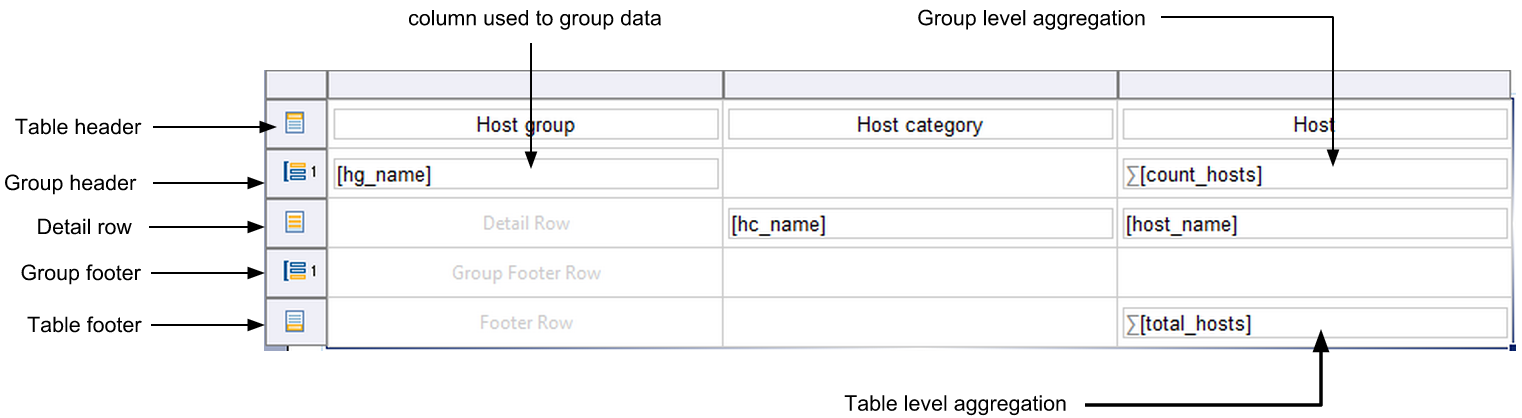
Grouping & aggregating data
A data set can return a large set of rows. These rows can be sorted and organized with the grouping functionality of a table. It is possible to create as many groups as columns available in a table. Each group created will add 2 rows in the table:
The group header: avoid the duplicated entries for the column used to create the group and allows the calculation of summary values by entry of the group
The group footer: avoid the duplicated entries for the column used to create the group and allows the calculation of summary values by entry of the group
Charts
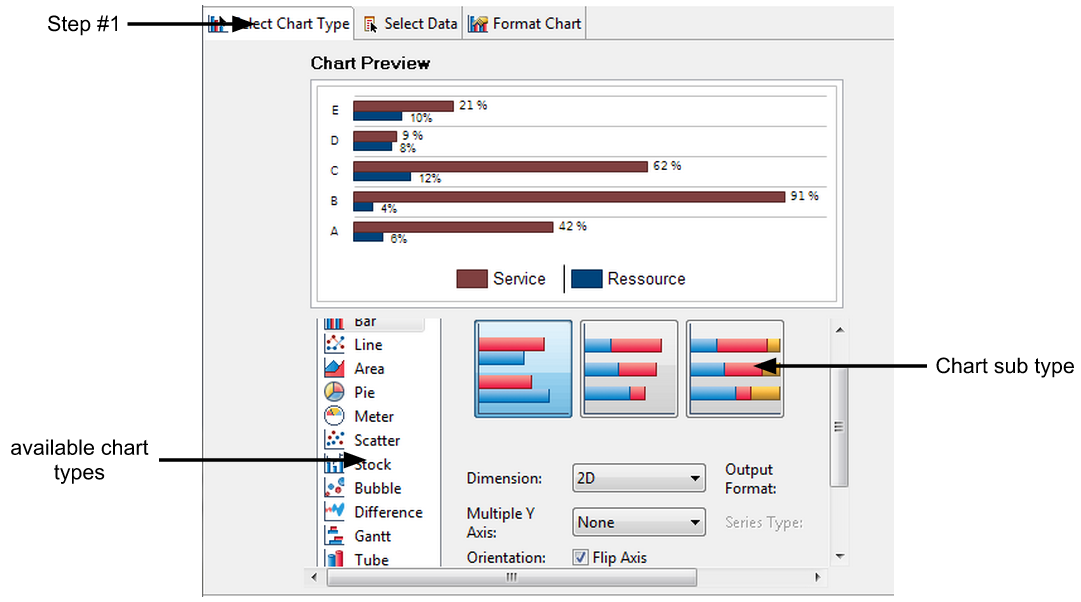
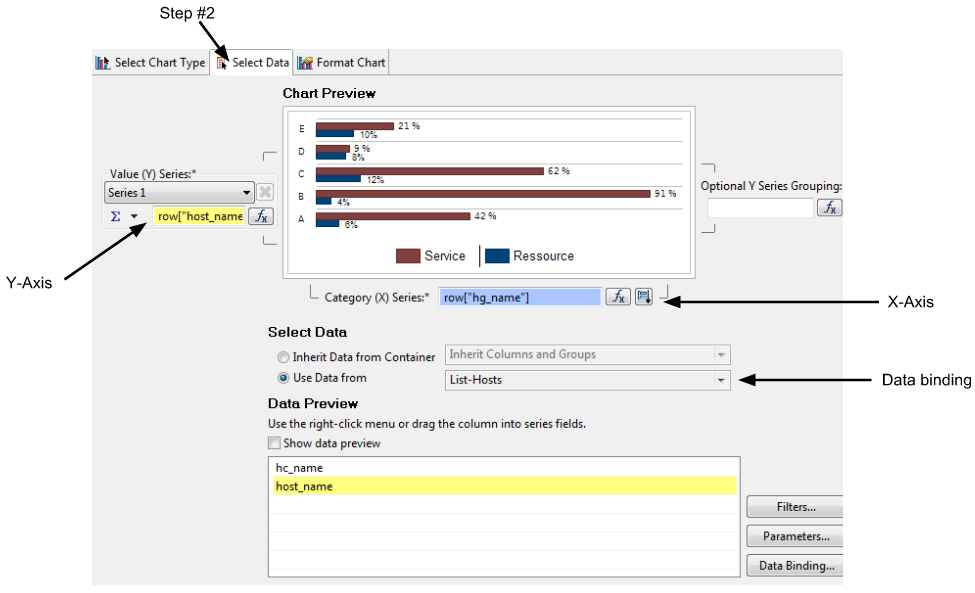
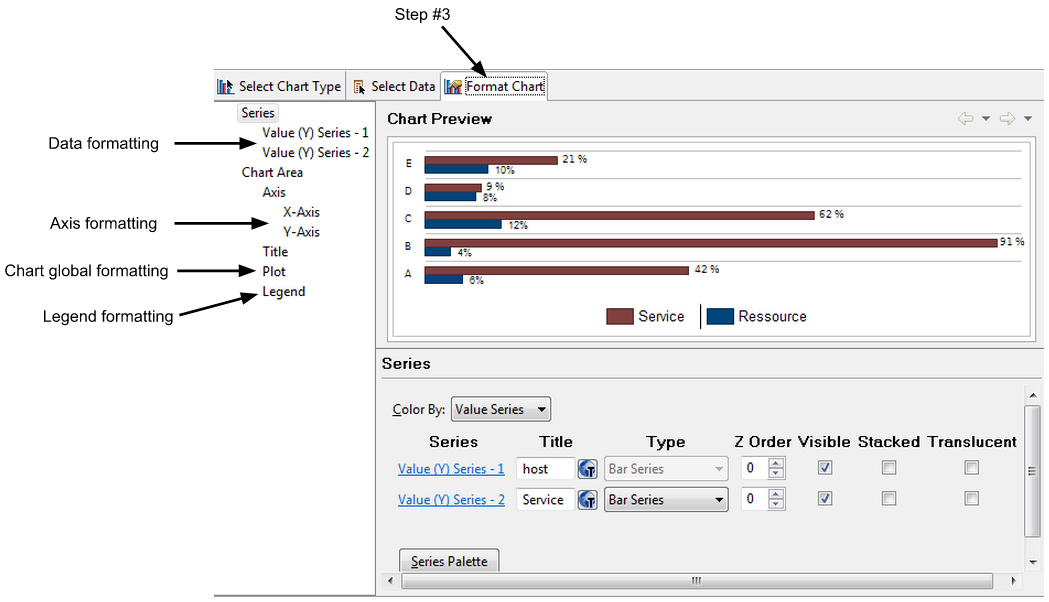
The creation of a chart is made in 3 main steps:
The graph type selection
The data binding
The data binding for a chart can be performed by inheritance when the chart is inserted in a cell of a table. Depending on the location of the chart, the chart will inherit from all or part of the data resulting from the table:
Chart inserted in the table header or footer: the chart will inherit all the data from the table
Chart inserted in a group header or footer: the chart will inherit only the filtered data from the group
The data inheritance from the parent component is necessary when we need to reuse the group level aggregations in a chart.
The chart formatting
BIRT Libraries
A report can contain a large number of components (data sources, data sets, charts, tables). Some components developed in a specific report can be needed in another report. In order to avoid the development of an existing component in a new report, the component can be stored in a library.
BIRT libraries (.rptlibrary files) are used to store components that will be shared between several reports. Advantages:
Time saving in the development of a report
Easy maintenance of the reports. The bug fix or the modification of a component in the library will be applied to every report using this component
A component coming from a library can be overloaded in a report in order to modify the appearance or the parameters of the component.
Principle of operation:
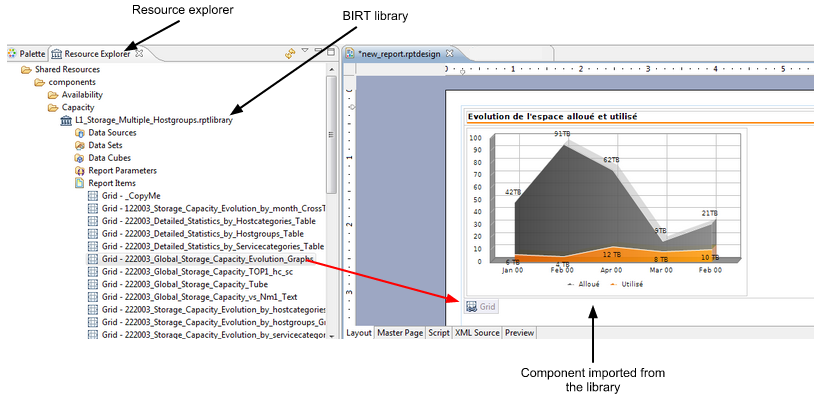
Each report project has a specific resource folder that stores all the shared resources that can be accessed in the report via a relative path: images, BIRT rptlibrary files, CSS files, …
The “resource explorer” panel in Eclipse BIRT navigates in the resource (rptlibrary) and select by drag-and-drop the component we need to import in the report
Each component imported from a library is displayed with a specific icon (chain link) in the report.
BIRT Templates
The report templates (.rpttemplate) is very different from the report libraries. The goal of a report template is to provide a starting point for a new report. A report template can contain:
The layout for a new report
The master pages
data sources
data sets
graphical components
scripting
Every component that you re-use each time you start the development of a new report can be stored in a template. These components can also be imported from BIRT libraries.
A report created from a template doesn’t maintain any relation with the original template because the content of the template is duplicated in the new report. In consequence, any modification applied in a template is never propagated in the reports that used this template.