Report Items
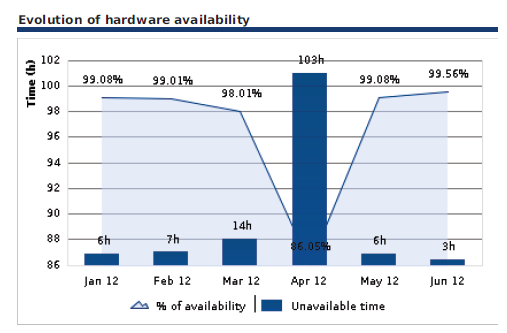
000100_Host_availability_incidents_by_months-Graph
Description: Graph diplaying the host availabality percent and the unavailability time for a given host group
 |
Report parameters |
| dateStart | |
| dateEnd | |
| liveserviceID | |
| evolutionInterval | |
| theme | |
| One-hostgroupID * |
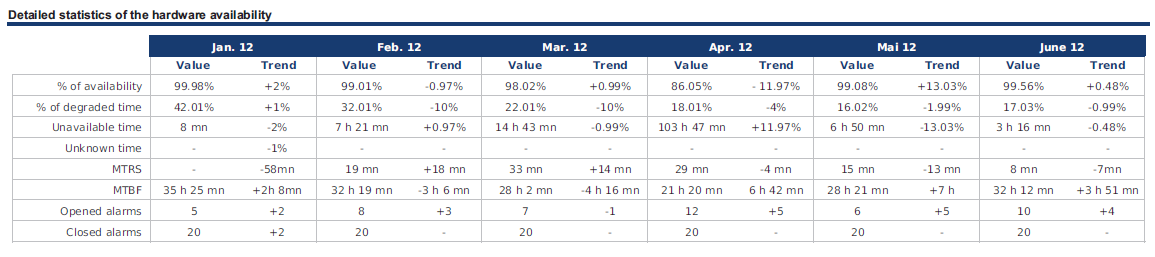
000100_Host_Availability_Stats_N_vs_Nm1_CrossTab
Description: This table gives a detailed evolution hosts statistics for a given host group. This statistics include percent of availability, unavailability and unknown time, MTBF, MTRS, opened and closed alarms
 |
Report parameters |
| dateStart | |
| dateEnd | |
| liveserviceID | |
| evolutionInterval | |
| theme | |
| One-hostgroupID * | |
| previousdateStart | |
| previousdateEnd |
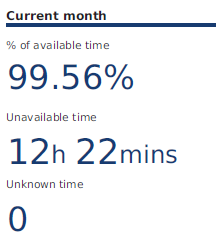
000100_Host_Availability_Stats-Text
Description: percent of availability and unavailable time hosts statistics for a given host group
 |
Report parameters |
| dateStart | |
| dateEnd | |
| liveserviceID | |
| theme | |
| One-hostgroupID * |
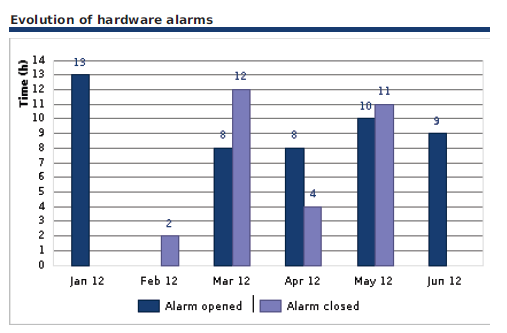
000100_Host_incidents_stats_by_months_Graphs
Description: Graph diplaying the evolution of opened and closed hosts alarms, on one host group
 |
Report parameters |
| dateStart | |
| dateEnd | |
| liveserviceID | |
| evolutionInterval | |
| theme | |
| One-hostgroupID |