Report Items
120000_host_alarms_by_host_TOP
Description: For a given host group, this list displays the top of hosts generating alarms, filtred by host categories
 |
Report parameters |
| hostcategoryID | |
| dateStart | |
| dateEnd | |
| liveserviceID | |
| theme | |
| One-hostgroupID * |
120000_host_unavailability_by_host_TOP
Description: List displaying the top hosts the less available, by one hostgroup, filtred by host categories
 |
Report parameters |
| hostcategoryID | |
| dateStart | |
| dateEnd | |
| liveserviceID | |
| theme | |
| One-hostgroupID * |
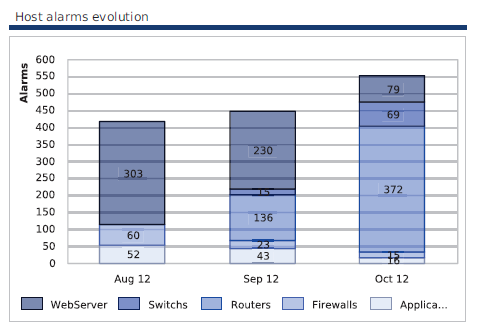
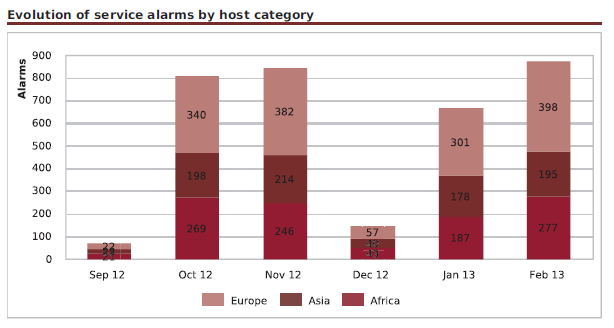
120000_hosts_incidents_by_hostcategories_months-Graph
Description: Graphs diplaying the host alarm evolution, for one hostgroup, filtred by host categories.
 |
Report parameters |
| hostcategoryID | |
| dateStart | |
| dateEnd | |
| liveserviceID | |
| theme | |
| One-hostgroupID * | |
| evolutionInterval |
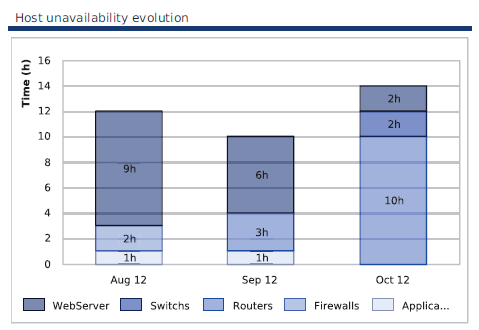
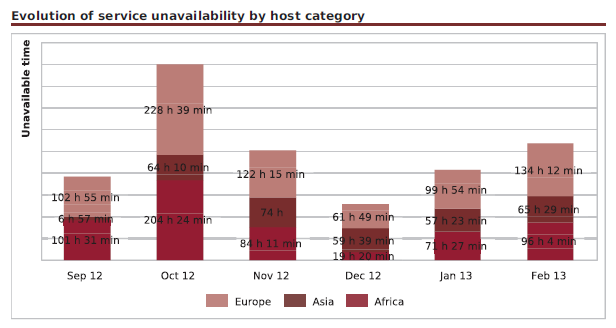
120000_hosts_unavailability_by_hostcategories_months-Graph
Description: Graph displaying the host unavailability evolution, for one hostgroup, filtred by hostcategories.
 |
Report parameters |
| hostcategoryID | |
| dateStart | |
| dateEnd | |
| liveserviceID | |
| theme | |
| One-hostgroupID * | |
| evolutionInterval |
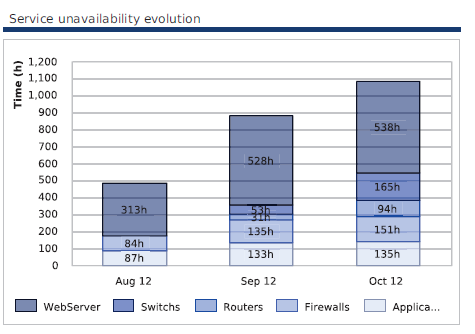
120000_services_unavailability_by_servicecategories_months-Graph
Description: Graph displaying the service unavailability evolution, for one hostgroup, filtred by host categories and service categories.
 |
Report parameters |
| hostcategoryID | |
| servicecategoryID | |
| dateStart | |
| dateEnd | |
| liveserviceID | |
| theme | |
| One-hostgroupID * | |
| evolutionInterval |
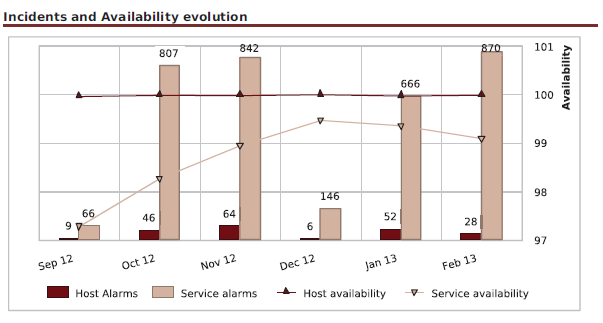
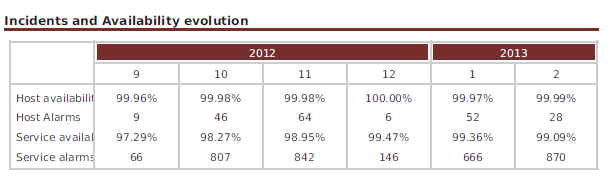
122000_Host_And_Service_availability_incidents_by_months-Graph
Description: Graph displaying for one host group, alarms and availability evolution for hosts and services, filtred by hosts and services categories
 |
Report parameters |
| hostcategoryID | |
| servicecategoryID | |
| dateStart | |
| dateEnd | |
| liveserviceID | |
| theme | |
| One-hostgroupID | |
| evolutionInterval |
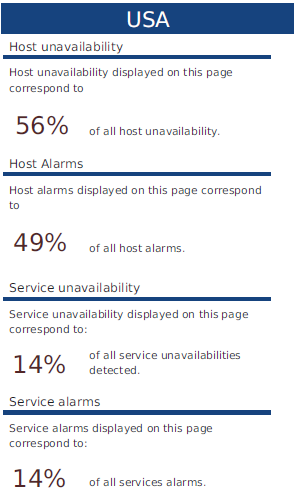
122000_host_and_service_unavailability_incident-Text
Description: Statistics on host unavailability, host alarms, service unavailability and service alarms on the current page.
 |
Report parameters |
| hostcategoryID | |
| servicecategoryID | |
| dateStart | |
| dateEnd | |
| liveserviceID | |
| theme | |
| One-hostgroupID | |
| topN |
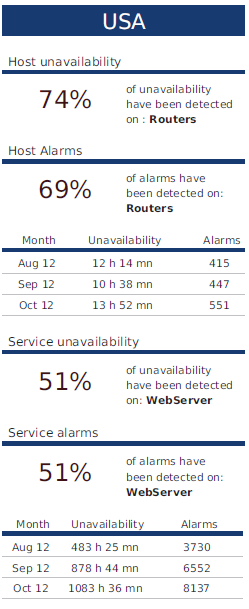
122000_host_and_services_unavailability_incidents_hostcategories_months-Text
Description: Statistics on host unavailability, host alarms, service unavailability and service alarms, by host categories and service categories
 |
Report parameters |
| hostcategoryID | |
| servicecategoryID | |
| dateStart | |
| dateEnd | |
| liveserviceID | |
| theme | |
| One-hostgroupID |
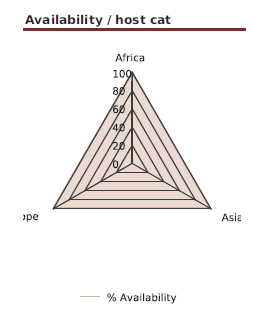
122000_host_availability_by_hostcategories-Radar
Description: Graph displaying the availability distribution by host categories, for one host group
 |
Report parameters |
| hostcategoryID | |
| dateStart | |
| dateEnd | |
| liveserviceID | |
| theme | |
| One-hostgroupID |
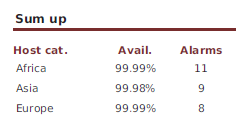
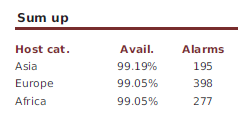
122000_host_availability_incidents_by_hostcategories-Table
Description: Table diplaying host availabiity and alarms, by host gategories, for a given host group.
 |
Report parameters |
| hostcategoryID | |
| dateStart | |
| dateEnd | |
| liveserviceID | |
| theme | |
| One-hostgroupID |
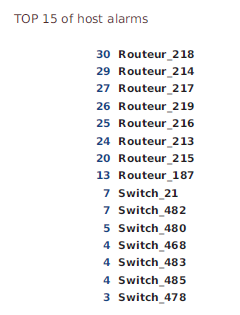
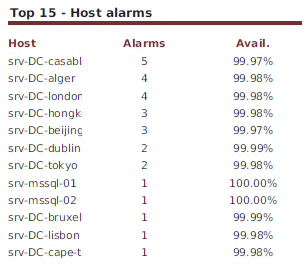
122000_host_incidents_by_host-TOP_2
Description: Top 15 of host alarms, filtred by host categories and classed by alarms number and percent availability, for a given host group
 |
Report parameters |
| hostcategoryID | |
| dateStart | |
| dateEnd | |
| liveserviceID | |
| theme | |
| One-hostgroupID * |
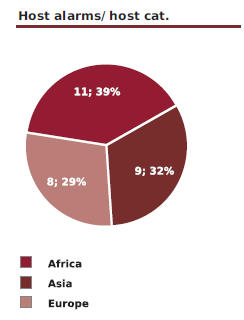
122000_host_incidents_by_hostcategories-Pie
Description: Graph diplaying the distribution of of host alarms, by host categories, for a given host group.
 |
Report parameters |
| hostcategoryID | |
| dateStart | |
| dateEnd | |
| liveserviceID | |
| theme | |
| One-hostgroupID |
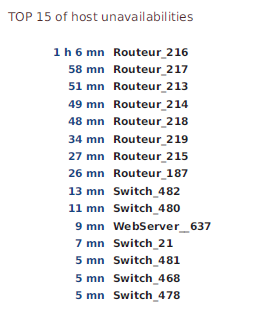
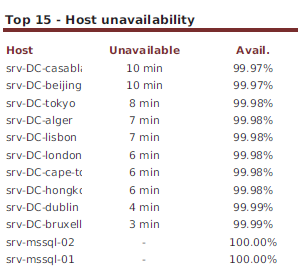
122000_host_unavailability_by_host-TOP_2
Description: Top 15 of host unavailability, filtred by host categories and classed by time unavailability and percent availability, for a given host group
 |
Report parameters |
| hostcategoryID | |
| dateStart | |
| dateEnd | |
| liveserviceID | |
| theme | |
| One-hostgroupID * |
122000_hostgroup_availability_incidents_by_months-CrossTable
Description: Table displaying the evolution of hosts and services alarm and availability, filtred by hosts and services categories, for a given host group
 |
Report parameters |
| hostcategoryID | |
| dateStart | |
| dateEnd | |
| liveserviceID | |
| theme | |
| One-hostgroupID | |
| evolutionInterval |
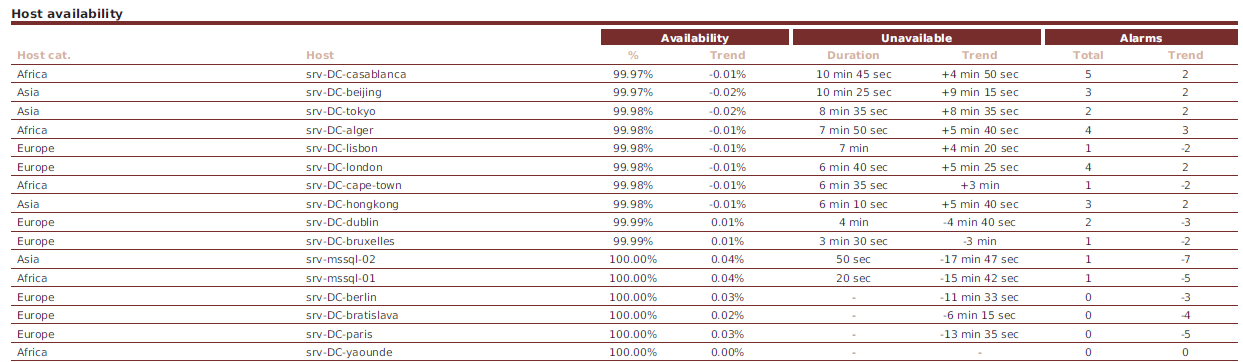
122000_IV_hostcategories_host_availability_alarms_N_vs_Nm1
Description: For a given host group, the table displays Host availability and alarms, classed host categories, percent, unavailability duration, total alarms and trend
 |
Report parameters |
| hostcategoryID | |
| dateStart | |
| dateEnd | |
| liveserviceID | |
| theme | |
| One-hostgroupID | |
| previousdateStart | |
| previousdateEnd |
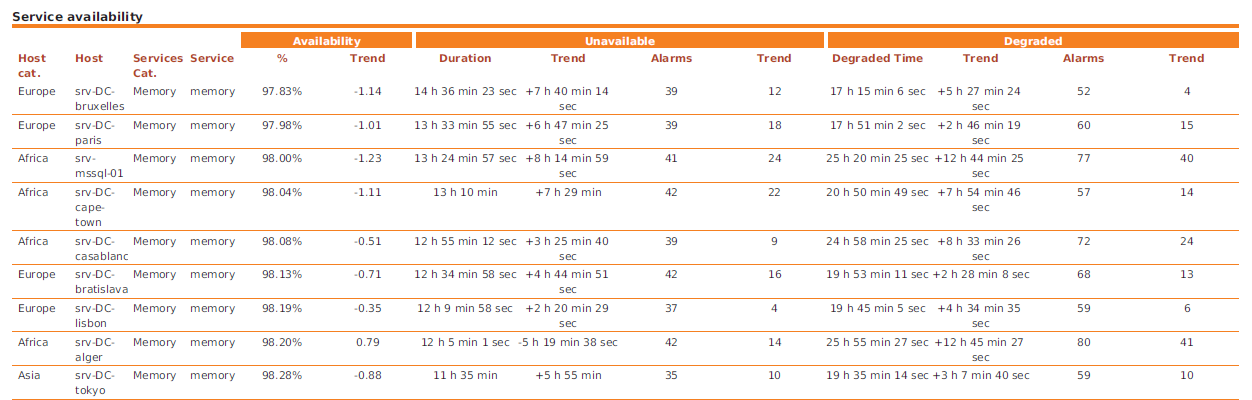
122000_IV_hostcategories_host_servicecategories_service_availability_alarms_N_vs_Nm1
Description: Table displaying the service unavailability and alarms statistics by host categorries, hosts, service categories
 |
Report parameters |
| hostcategoryID | |
| dateStart | |
| dateEnd | |
| liveserviceID | |
| theme | |
| One-hostgroupID | |
| servicecategoryID | |
| previousdateStart | |
| previousdateEnd |
122000_service_availability_incidents_by_hostcategories-Table
Description: Table diplaying service availabiity and alarms number, by host categories, for a given host group
 |
Report parameters |
| hostcategoryID | |
| servicecategoryID | |
| dateStart | |
| dateEnd | |
| liveserviceID | |
| theme | |
| One-hostgroupID * |
122000_service_availability_incidents_by_servicecategorties-Table
Description: Table diplaying service availabiity and alarms number, by service categories, for a given host group
|
Report parameters |
| hostcategoryID | |
| servicecategoryID | |
| dateStart | |
| dateEnd | |
| liveserviceID | |
| theme | |
| One-hostgroupID * |
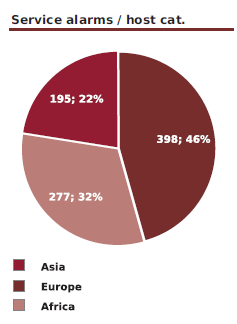
122000_service_incidents_by_hostcategories-Pie
Description: Graph diplaying the distribution of service alarms, by host categories, for a given host group.
 |
Report parameters |
| hostcategoryID | |
| servicecategoryID | |
| dateStart | |
| dateEnd | |
| liveserviceID | |
| theme | |
| One-hostgroupID * |
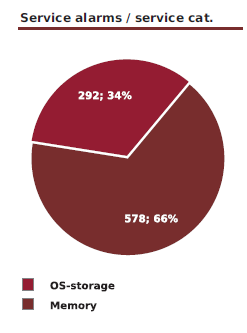
122000_service_incidents_by_servicecategories-Pie
Description: Graph diplaying the distribution of service alarms, by service categories, for a given host group.
 |
Report parameters |
| hostcategoryID | |
| servicecategoryID | |
| dateStart | |
| dateEnd | |
| liveserviceID | |
| theme | |
| One-hostgroupID * |
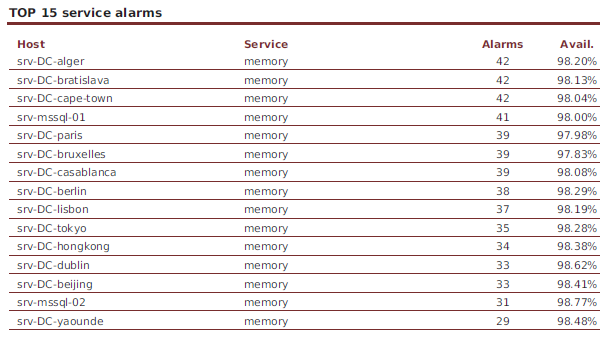
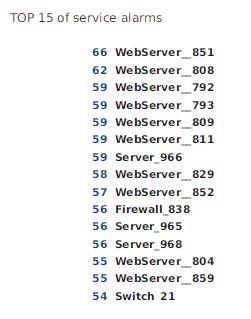
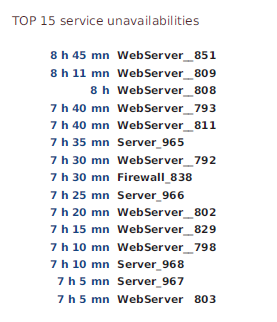
122000_service_incidents_list-TOP
Description: Top 15 of service alarms, filtred by host and service categories and classed by alarms number and percent availability, for a given host group
 |
Report parameters |
| hostcategoryID | |
| servicecategoryID | |
| dateStart | |
| dateEnd | |
| liveserviceID | |
| theme | |
| One-hostgroupID |
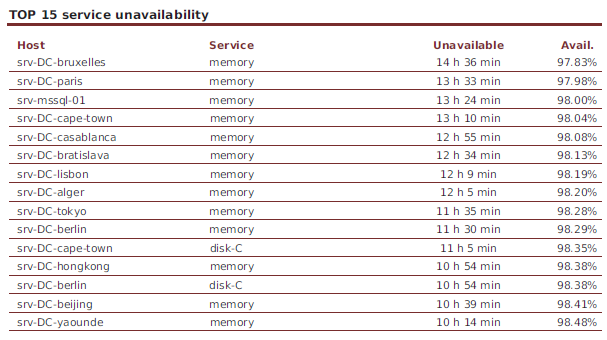
122000_service_unavailability_list-TOP
Description: Top 15 of services unavailability, filtred by host and service categories and classed by time unavailability and percent availability, for a given host group
 |
Report parameters |
| hostcategoryID | |
| servicecategoryID | |
| dateStart | |
| dateEnd | |
| liveserviceID | |
| theme | |
| One-hostgroupID |
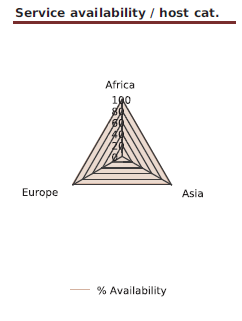
122000_serviceavailability_by_hostcategories-Radar
Description: Graph diplaying the distribution for the services availability by host categories, for a given host group
 |
Report parameters |
| hostcategoryID | |
| servicecategoryID | |
| dateStart | |
| dateEnd | |
| liveserviceID | |
| theme | |
| One-hostgroupID * |
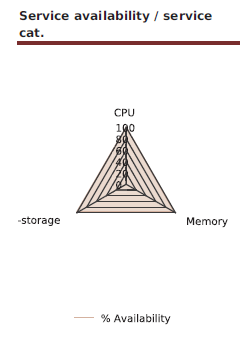
122000_serviceavailability_by_servicecategories-Radar
Description: Graph diplaying the distribution for the services availability by service categories, for a given host group
 |
Report parameters |
| hostcategoryID | |
| servicecategoryID | |
| dateStart | |
| dateEnd | |
| liveserviceID | |
| theme | |
| One-hostgroupID * |
122000_services_alarms_by_host_TOP
Description: For a given host group, this list displays the top 15 of host, which have the most important number of alarms generating of their services, filtred by host and service categories
 |
Report parameters |
| hostcategoryID | |
| servicecategoryID | |
| dateStart | |
| dateEnd | |
| liveserviceID | |
| theme | |
| One-hostgroupID * |
122000_services_incidents_by_hostcategories_months-Graph
Description: Graph displaying the evolution of service alarms by host categories, for a given host group
 |
Report parameters |
| hostcategoryID | |
| servicecategoryID | |
| dateStart | |
| dateEnd | |
| liveserviceID | |
| theme | |
| evolutionInterval | |
| One-hostgroupID * |
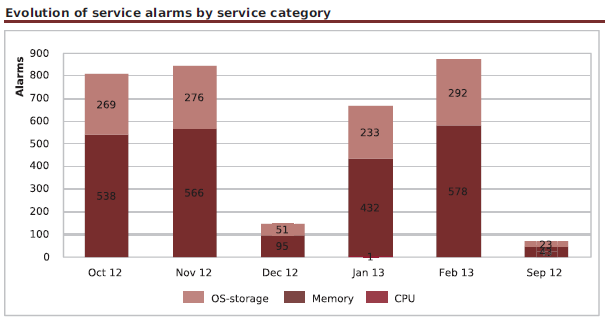
122000_services_incidents_by_servicecategories_months-Graph
Description: Graph displaying the evolution of service alarms by service categories, for a given host group
 |
Report parameters |
| hostcategoryID | |
| servicecategoryID | |
| dateStart | |
| dateEnd | |
| liveserviceID | |
| theme | |
| evolutionInterval | |
| One-hostgroupID * |
122000_services_unavailability_by_host_TOP
Description: For a given host group, this list displays the top 15 of host, which have the most longuest sum of unavailability on their services, filtred by host and service categories
 |
Report parameters |
| hostcategoryID | |
| servicecategoryID | |
| dateStart | |
| dateEnd | |
| liveserviceID | |
| theme | |
| One-hostgroupID * |
122000_services_unavailability_by_hostcategories_months-Graph
Description: For a given host group, this graph displays the evolution of service unavailability by host category, filtred by service category
 |
Report parameters |
| hostcategoryID | |
| servicecategoryID | |
| dateStart | |
| dateEnd | |
| liveserviceID | |
| theme | |
| evolutionInterval | |
| One-hostgroupID * |