Report Items
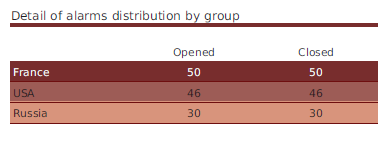
220000_incidents_by_hostgroups-Table
Description: Table diplaying the opened and the closed alarms by hostgroups
 |
Report parameters |
| dateStart | |
| dateEnd | |
| liveserviceID | |
| hostgroupID | |
| hostcategoryID | |
| theme |
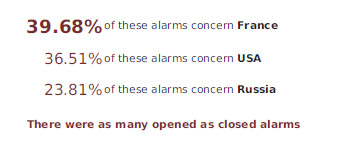
220000_incidents_open_closed_top3-Text
Description: Object diplaying the top 3 alarms by hostgroups filtred by host categories
 |
Report parameters |
| dateStart | |
| dateEnd | |
| liveserviceID | |
| hostgroupID | |
| hostcategoryID | |
| theme |
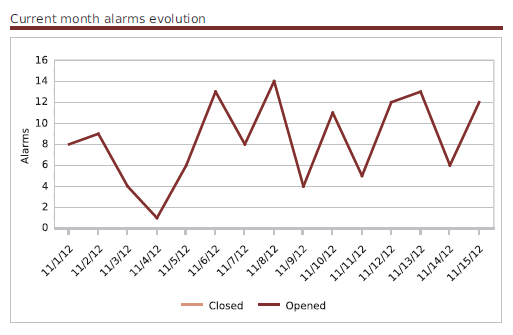
220000_open_close_incidents_by_days-Graph
Description: Graph diplaying the alarms evolution in the current month, for a multiple hostgroups , filtred by host categories
 |
Report parameters |
| dateStart | |
| dateEnd | |
| liveserviceID | |
| hostgroupID | |
| hostcategoryID | |
| theme |
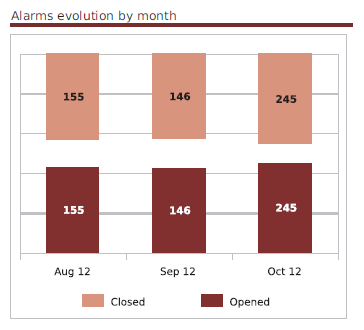
220000_open_close_incidents_by_months-Graph
Description: Graph diplaying the alarms evolution by months for mintiple hostgroups , filtred by host categories
 |
Report parameters |
| dateStart | |
| dateEnd | |
| liveserviceID | |
| evolutionInterval | |
| hostgroupID | |
| hostcategoryID | |
| theme |
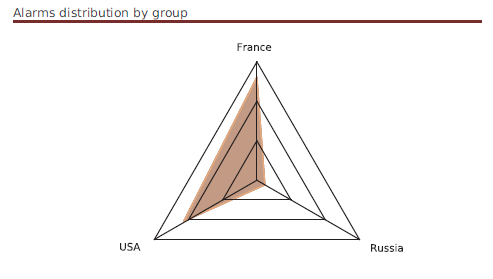
220000_open_closed_incidents-Radar
Description: Graph diplaying the alarms distribution by hostgroups , filtred by host categories
 |
Report parameters |
| dateStart | |
| dateEnd | |
| liveserviceID | |
| hostgroupID | |
| hostcategoryID | |
| theme |
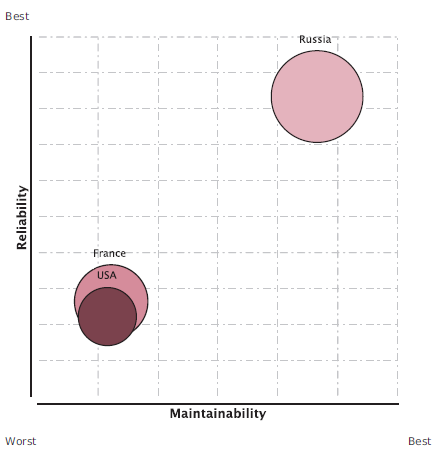
220000_reliability_maintenability_by_hostgroups-Bubbles
Description: Graph diplaying the eability and the maintenability of hostgroups, filtred by host categories
 |
Report parameters |
| dateStart | |
| dateEnd | |
| liveserviceID | |
| hostgroupID | |
| hostcategoryID | |
| theme |
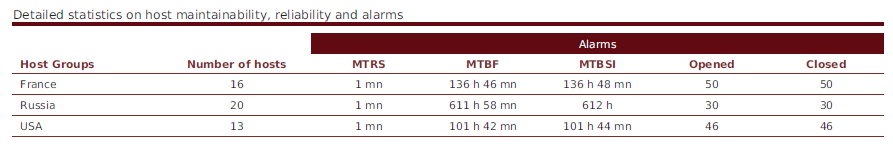
220000_reliability_maintenability_incidents_by_hostgroups-Table
Description: For multiple hostgroups, this table diplays detailed statistics on host maintenanbility, reliabinity and alarms, filtred by host categories
 |
Report parameters |
| dateStart | |
| dateEnd | |
| liveserviceID | |
| hostgroupID | |
| hostcategoryID | |
| theme |