Report Items
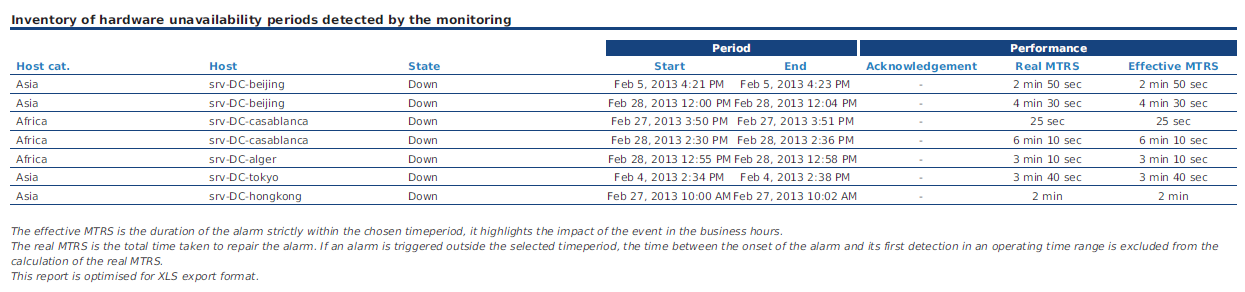
120000_Host_events_detail
Description: For multiple hostgroups, this table diplays detailed statistics on host maintenanbility, reliabinity and alarms, filtred by host categories
|
Report parameters |
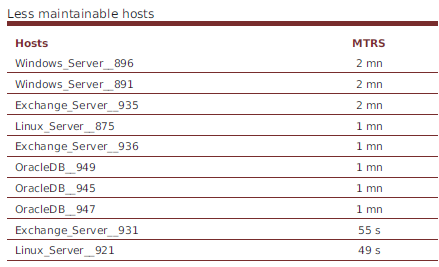
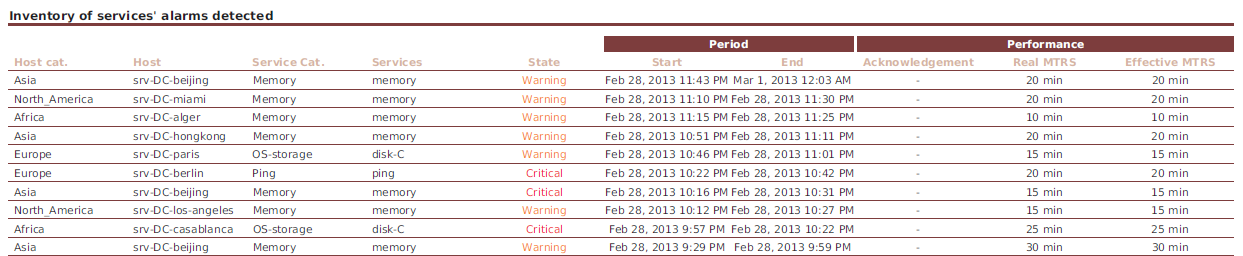
120000_maintenability_by_host-TOP
Description: Inventory of services alarms by hostgroup, filtred on host categories
|
Report parameters |
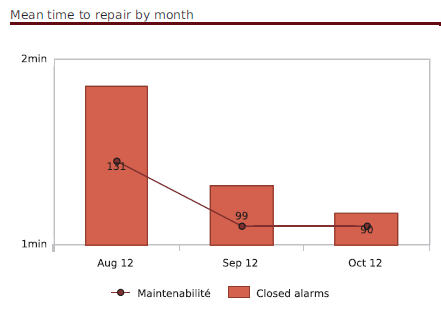
120000_maintenability_incidents_closed_by_months-Graph
Description: Graph displaying the evolution of maintenability and the closed alarms for a host group, filtred on host categories
|
Report parameters |
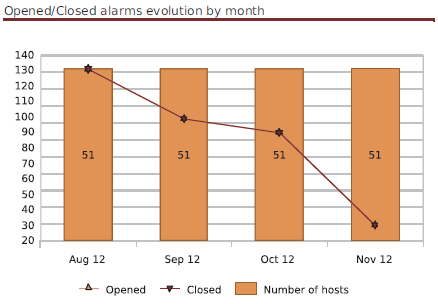
120000_open_closed_incidents_nb_hosts_by_months-Graph
Description: Graph displaying the evolution of hosts, the opened and closed alarms, for one host group, filtred on host categories
|
Report parameters |
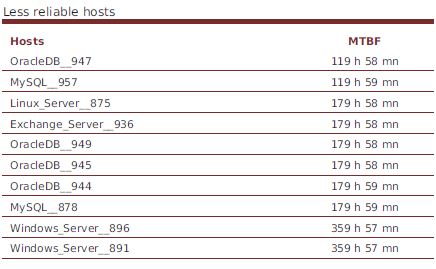
120000_reliability_by_host-TOP
Description: List diplaying the less reliable hosts by host group, filtred on host categories.
|
Report parameters |
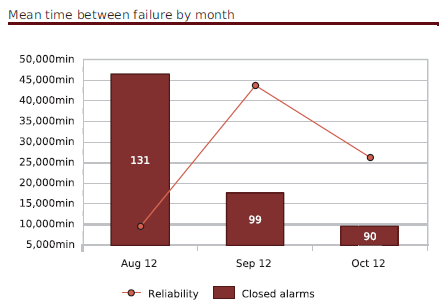
120000_reliability_incidents_closed_by_months-Graph
Description: Graph displaying the evolution of reliability and the closed alarms for a host group, filtred on host categories
|
Report parameters |
120000_Service_event_detail
Description: Graph displaying the evolution of reliability and the closed alarms for a host group, filtred on host categories
|
Report parameters |
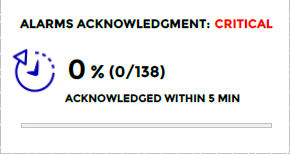
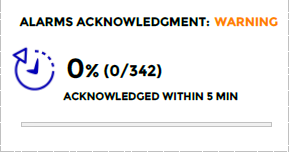
120000_Service_critical_acked
Description: For a hostgroup filtred on host and service categories, this object displays the rate of critical alarms acked on a delay in minutes given as parameters.
|
Report parameters |
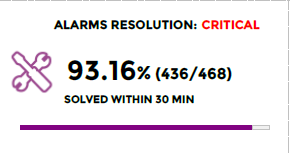
120000_Service_critical_solved
Description: For a hostgroup filtred on host and service categories, this object displays the rate of critical alarms solved on a delay in minutes given as parameters.
|
Report parameters |
120000_Service_warning_acked
Description: For a hostgroup filtred on host and service categories, this object displays the rate of warning alarms acked on a delay in minutes given as parameters.
|
Report parameters |
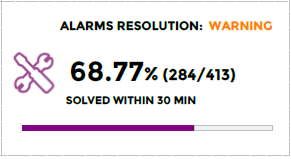
120000_Service_warning_solved
Description: For a hostgroup filtred on host and service categories, this object displays the rate of warning alarms acked on a delay in minutes given as parameters.
|
Report parameters |
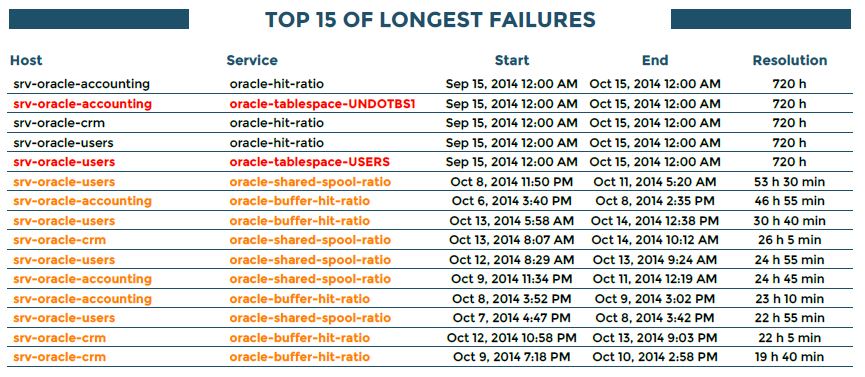
120000_Service_event_duration_top
Description: For a hostgroup filtred on host and service categories, this object displays the TOP x of the longuest failures.
|
Report parameters |
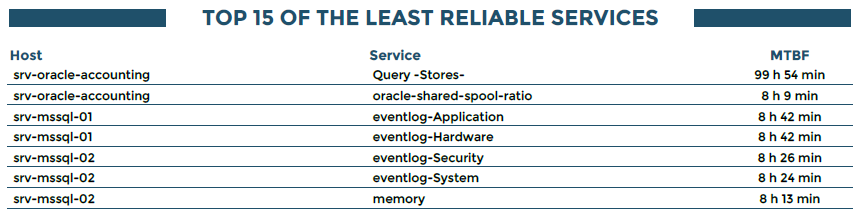
120000_Service_mtbf_top
Description: For a hostgroup filtred on host and service categories, this object displays the TOP x of the least reliable services.
|
Report parameters |
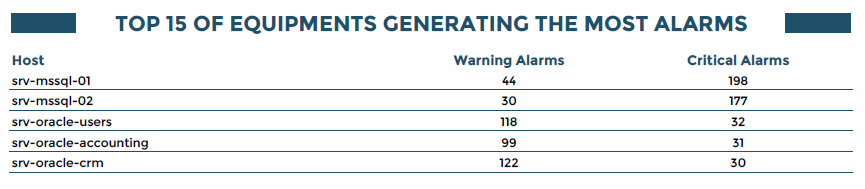
120000_number_events_by_type_by_host_top
Description: For a hostgroup filtred on host and service categories, this object displays the TOP x of equipments generrating the most alarms.
|
Report parameters |