Prerequisites
Centreon server
Software
Centreon |
19.10.x |
Note
Check that the parameter date.timezone is correctly configured in /etc/opt/rh/rh-php71/php.ini (same timezone displayed with the command “timedatectl status” )
Avoid the usage of the following variables in your monitoring MySQL configuration. They halt long queries execution and can stop the ETL or the report generation jobs:
wait_timeout
interactive_timeout
Users and groups
User |
Group |
centreonBI (new) |
apache, centreon, centreonBI |
apache (existing) |
centreonBI |
Description of users, umask and home directory
User |
umask |
home |
centreonBI |
0002 |
/home/centreonBI |
Prerequisites: reporting server
Hardware
Monitored services |
CPU |
RAM |
|---|---|---|
< 4 000 |
2 CPU ( 3Ghz ) minimum |
12GB minimum |
< 20 000 |
4 CPU (3GHz) minimum |
16GB minimum |
>= 20 000 and < 40 000 |
4 CPU (3GHz) minimum |
24GB minimum |
> 40 000 and < 100 000 |
8 CPU (3GHz) minimum |
32GB minimum |
> 100 000 |
Contact Centreon |
|
Storage space: use the following storage estimation file
File system
File system |
Size |
/ |
5GB minimum |
/var (containing MySQL data) |
Use the result of the above disk-space simulation file |
MySQL temp folder |
We recommand keeping it in /var |
Volume group* |
5GB minimum of free space on the Volume group hosting the MySQL/MariaDB DBMS data |
To check the free space use the command below, replacing vg_data by the Volume group name:
vgdisplay vg_data | grep -i free
Software
OS |
CentOS 7 / Redhat 7 |
SGBD |
MariaDB 10.1.x |
Firewall |
Disabled |
SELinux |
Disabled |
Dependencies automatically installed:
Java |
Openjdk >= 1.7 |
Perl |
perl-DBD-MySQL perl-XML-LibXML |
We advise to tune your MySQL database server on your reporting server in order to have better performance.
You will need at least 12GB on your reporting server to run the configuration file provided below.
Add the following file (centreon.cnf) on your reporting server in /etc/my.cnf.d/ by the following one: . Make sure to have a tmp folder in /var/lib/mysql.
Warning
Do not run these optimizations on your monitoring server.
Users and groups :
User |
Group |
centreonBI |
centreonBI |
Description of users, umask and home directory:
User |
umask |
home |
centreonBI |
0002 |
/home/centreonBI |
License
In order to be able to use Centreon MBI, you need to retrieve a license file.
To generate it, we need the fingerprint of the machine on which Centreon MBI’s interface is installed (Central server). The fingerprint is generated using Centreon Fingerprint which is packaged in RPM and is available on the Centreon repository.
Install the Centreon Fingerprint binary.
# yum install centreon-fingerprint
Execute Centreon Fingerprint
# centreon-fingerprint
The machine fingerprint will be displayed in the console.
You will have to provide it to Centreon Support that will generate the license file you need to use Centreon MBI. You’ll install it during the installation procedure.
Best practices for monitoring
Quality of plugins, performance and capacity data
To obtain reporting on performance data using default Centreon MBI reports, you should monitor at least some basic performance indicators (metrics):
CPU – Should return a percentage value, using one or more metrics (cpu_total, cpu_sys, cpu_1, etc.), with 100 as the maximum value.
Memory should return at least one metric with this information:
Memory usage: the value expressed in bytes only
Memory usage warning threshold
Memory usage critical threshold
Total allocated memory in Bytes.
The plugin for monitoring this indicator must return the following output:
status information | metric_name=valueunit;warning_threshold;critical_threshold;min_value;max_value
Storage usage – Two possible kinds of service:
Monitoring one partition by service (metrics are often designated as “used” and “size”)
Monitoring multiple partitions by service and each metric corresponds to a partition name.
In this two cases, the performance data returned by storage plugins have to correspond to this format:
status information | metric_name=valueunit;warning_threshold;critical_threshold;min_value;max_value metric_name_2=value...
Traffic – Standard traffic reports use two metrics in parameters, one for the inbound traffic and one for the outbound. For compatibility, your plugins must return two metrics, although their names do not matter. For each metric, the maximum possible value must be specified. This is the recommended plugin format:
*any status information* | **$inboundTrafic=$value$unit;$warning_threshold;$critical_threshold;$min_value;$max_value $outBoundTrafic=...**
Note
Using the Centreon Plugin Packs guarantees the quality of your data.
Default units
Be sure that the data sent by the plugins is expressed in the same units as similar data used with other services. We strongly recommend verifying that the plugins use these units:
Time: seconds
Traffic: bits/sec
Storage: bytes
Memory/Swap: bytes
Note
Using the Centreon Plugin Packs guarantees the quality of your data.
Best practices for configuring Centreon objects
In Centreon MBI, each report design has several parameters that allow you to generate customized documents according to your business requirements.
Parameter types can be:
A main object on which the report will be generated, such as:
A host
A host group: functional group defined in Centreon to classify hosts by customer, application, business unit, country, etc.
Several host groups.
A time period (or “Business hours” also called “Live service”) for which statistics will be calculated.
Filters that take into account only specific types of hardware, services and metrics from selected host groups:
Host categories: Classifies hosts into technical groups for determining the type or technical function of a host (e.g., Linux servers, Windows servers, Cisco routers, printers).
Service categories: Defines the type of service (e.g., CPU, physical memory, storage).
Metrics: Indicates performance data collected by the services (monitoring indicators). One monitoring service can collect several metrics. However metric names and units are not standardized. For instance, one CPU-type service can collect only a metric called “cpu_average” defined in percentages, and another CPU-type service can collect a metric by CPU core configured in the hardware. Therefore, when generating a report, it is essential to select the metrics used in the statistic calculation.
Host groups and categories
The definitions of host groups and categories listed in the previous chapter comply with the best practices established by Centreon.
However, the groups and categories that you create should correspond to your business requirements.
Example:
If you need to report the number of alerts generated by IT field, with a detailed distribution by type of hardware, you will have to define the host groups and categories using this method:
Host groups: Databases, Applications, Security, Network, Mail, etc.
Host categories: DB2-Servers, MySQL-Servers, Oracle-Servers, SQL-Servers, etc.
Here is an exemple of statistics that you can obtain using those groups and categories:
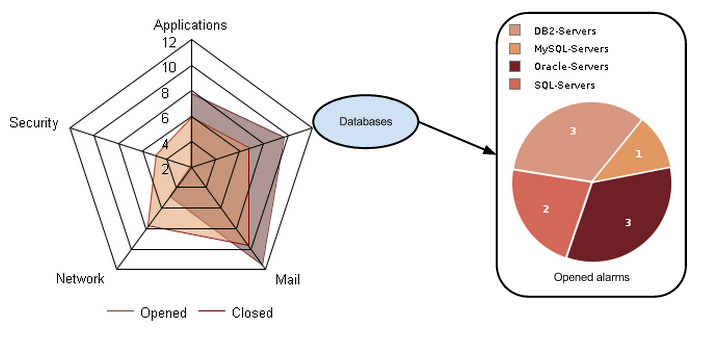
The host group is the first analysis axis. The host category allows you to analyze the statistics in subsets.
In the same way, we can analyze the statistics using the following dimensions:
By country (host group) with a data distribution by type of network hardware (host category)
By country (host group) with a data distribution by customer (host category)
By customer (host group) with a data distribution by country (host category)
By customer (host group) with a data distribution by application server (host category)
There is no standard set of rules for defining host groups and categories. They must correspond to your reporting needs.
Creating categories and groups
You associate hosts to host groups in the Configuration > Hosts > Host groups menu on the Centreon interface. You can also use the Tab Relations in the host add/modification form.
You associate hosts and host categories in the menu Configuration > Hosts > Categories. You can also use the Tab Relations in the host add/modification form.
Service categories
Service categories allow you to organize services (monitoring indicators) into subsets. The most common usage of service categories is for defining categories based on service types, e.g., CPU, physical memory, storage, Process-Oracle, DNS, Process-WebSphere.
This type of configuration lets you:
Compare the number of alerts generated by each type of service.
Select the service category that indicates storage usage information when you need to generate a capacity report.
Like the host groups and categories, service categories must be defined according to your reporting needs.
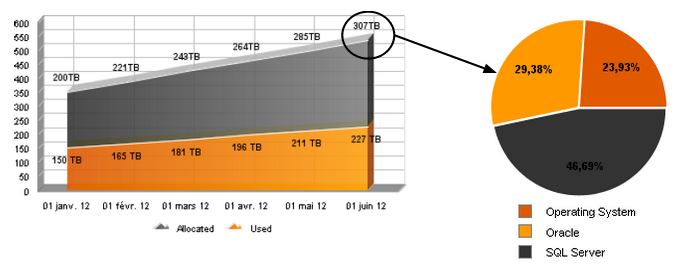
For instance, if you need to analyze the storage space allocated and used by DBMS or an application type, you may need to create several service categories. Instead of using only one service category named “Storage” or “Disk” you could create these service categories:
“Operating system”
“Oracle”
“SQL Server”
Here is an exemple of statistics that you can obtain using these service categories:
You associate services and service categories in the Configuration > Services > Categories menu in the Centreon Interface. You can also use the Relation tab in the add/modification form of a given service.
Note
For managing service categories, we highly recommand that you only use the service templates.