BIRT Concepts
Data sources
When designing a report, you may require several data sources from a number of storage systems accessible through different protocols:
Delimited flat files (CSV).
JDBC data sources (MySQL, etc.).
XML files.
Web services.
BIRT also allows you to script your own data sources accessed by Java or Javascript objects.
We highly recommend collecting and consolidating report data into a single type of data source, and storing it as such (e.g., a MySQL data). Multiplying your data sources in a report might have an impact on performance and maintenance. You are advised not to use more than of two types of data sources in the same report project (e.g., JDBC and CSV).
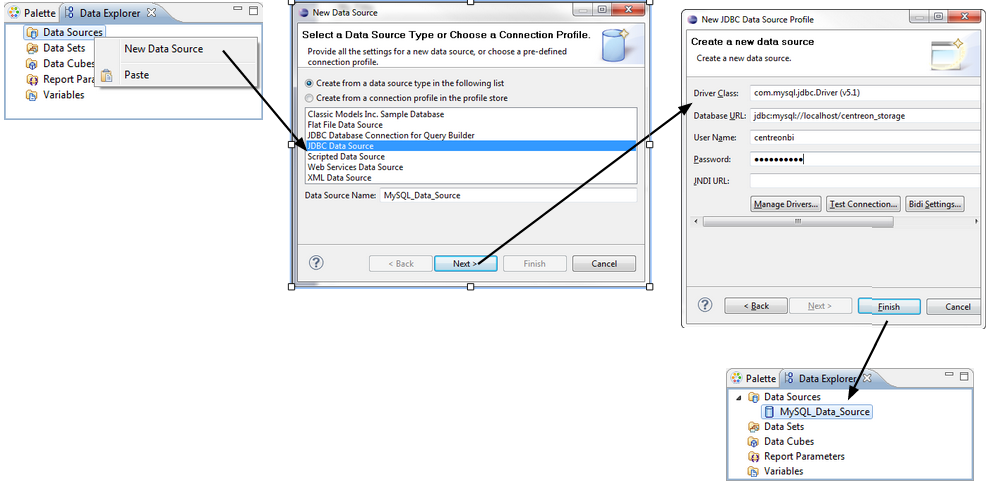
Configuration of a data source:
Data sets
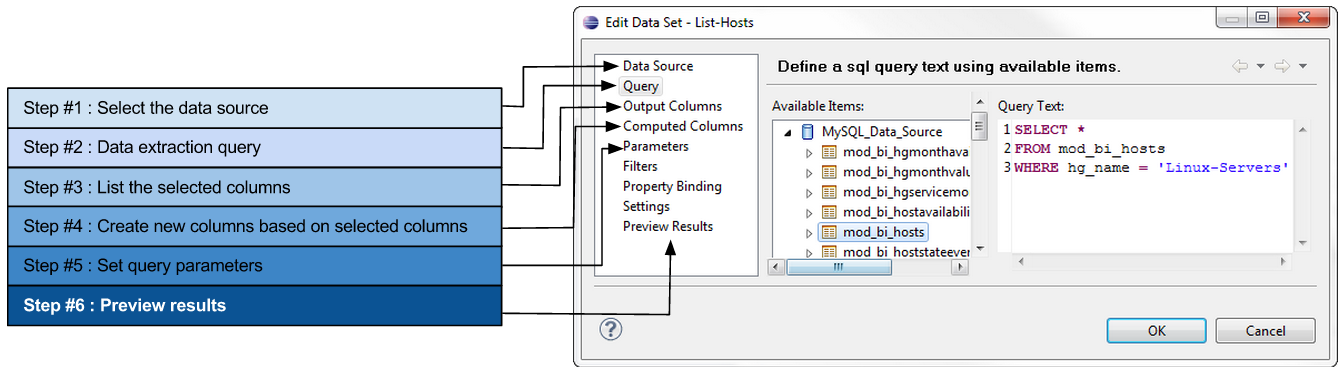
You may want to extract a data sample from an application database or a large CSV file. The BIRT “data set” allows you to write queries or select specific data from simple or complex data sources.
The different data sets defined in a report will contain all the available data to build the visuals in the report (e.g., tables and charts).
Data binding
Once the data set is created, the selected data must be formatted in the report. To populate a graph or a table with data, you will need to perform a “data binding” operation between a data set and a graphic component, such as a table or chart.
Data binding will copy the structure of the data set into the configuration of the graphical component. The complete structure (columns) of a data set does not need to be copied to the layout, only the required columns.
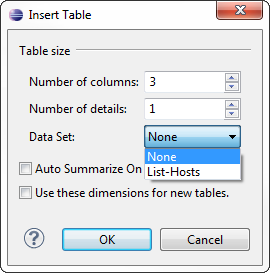
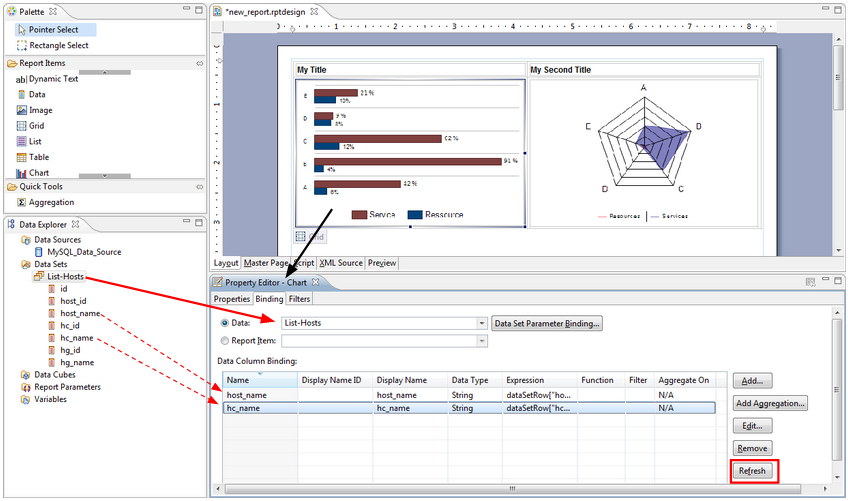
Data binding is performed when you create a table or chart:
If you modify the structure of the data set, you will need to manually edit the graphical component and apply this change (e.g., when extracting a new column from the data set to be used in a previously created chart):
Report parameters
Report parameters are global variables that are specific to each report. Declared before generating the report, they are used instead of static values to create dynamic content. For example, a report can be generated for:
A specific time period defined using two parameters (types “Date” and “Time”) identifying the period start and end dates.
A specific host group specified by a report parameter.
Therefore, using report parameters will allow you to use the same report design to display different statistics depending on the parameters (e.g., the same Centreon Availability report used for different host groups and different reporting periods).
For more details, see the chapter Report parameters.
Report layout
Grid
The grid component is mainly used to organize graphical components on the report.
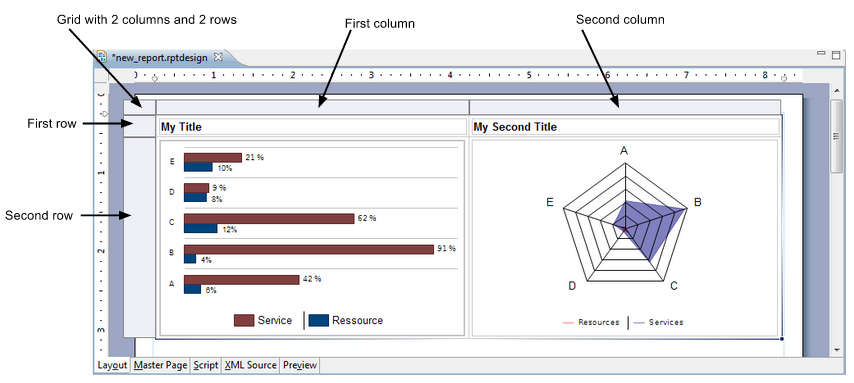
Best practice: Insert each report component (e.g., chart, table, label, text) into a grid cell.
Table
The table is used to display dynamic content in a row-and-column format. The values of a table vary according to the data set used for the data binding.
Table structure
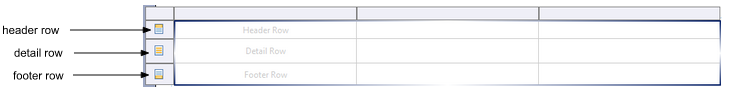
Header: Displays the column title or dynamic summary information calculated according to the listed values in the detail rows. The header row can be repeated at the beginning of each section if the table is displayed for several pages.
Detail row: A new detail row will be created to display each row of the data set (to which the table is bound).
Footer: Summary information, such as total or average values from the detail rows, can be displayed once in the last line of the table.
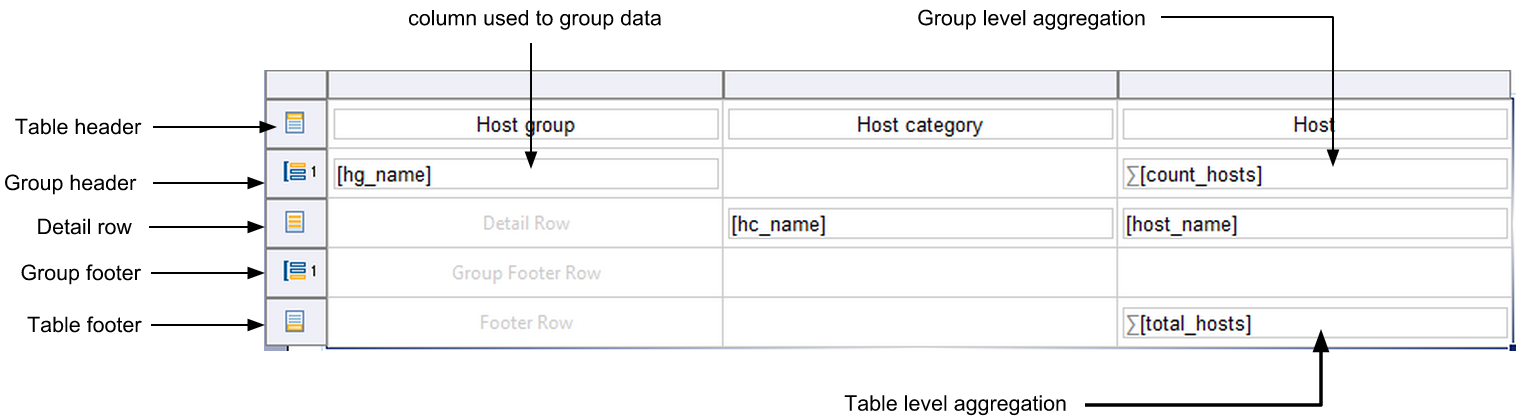
Grouping & aggregating data
A data set can return a large number of rows. You can sort and organize these rows using the table’s grouping function. Each group will add two rows to the table:
Group header: Initializes and identifies each entry. Allows statistics to be calculated using this data group.
Group footer: Delimits the end of each entry. Also allows the data group to be used for calculations.
Charts
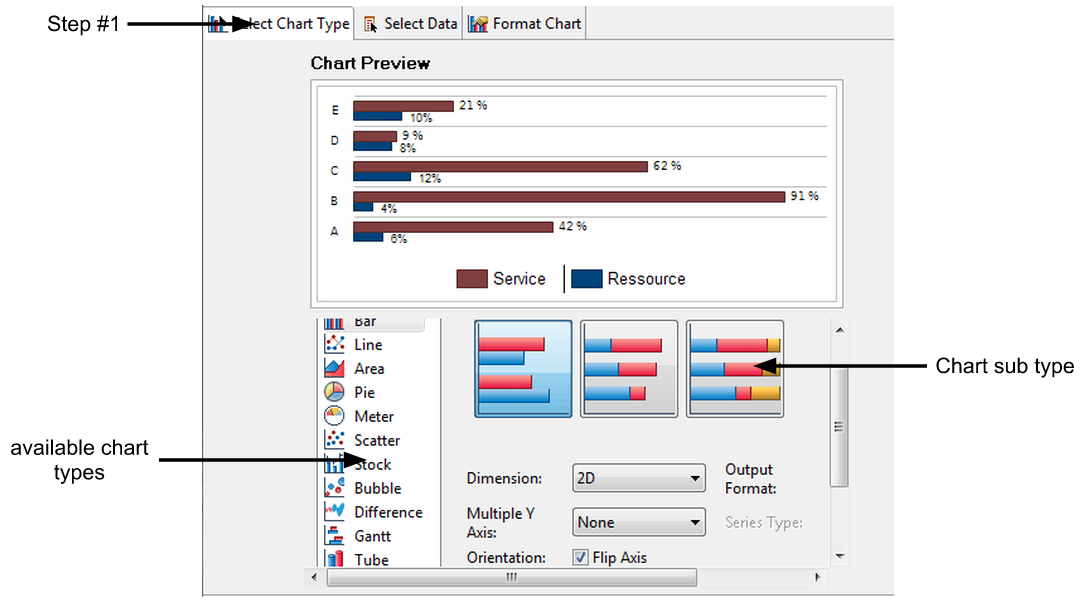
A chart can be created in three steps:
Selecting the graph type
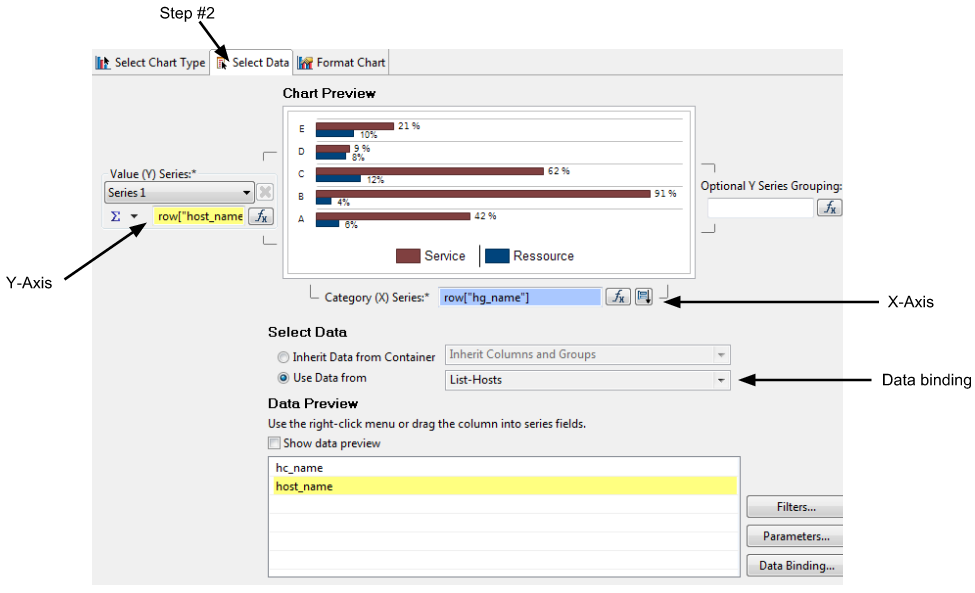
Binding the data
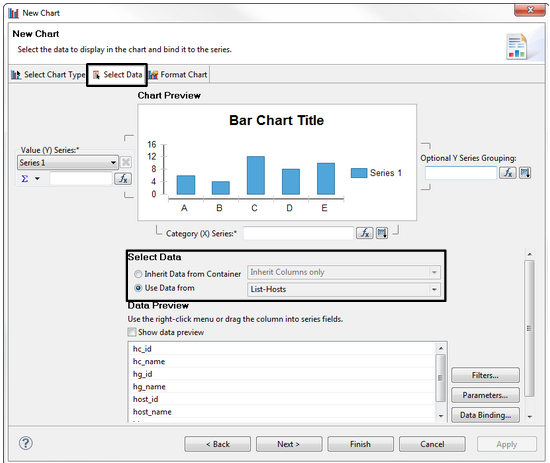
There are two ways to “bind” data to a chart:
Link the data set directly to the chart.
Insert the chart into a table cell. This will allow the chart to “inherit” the data from the table thus binding it.
The data inheritance from a parent component is required if you decide to reuse data groups and aggregated data in a chart.
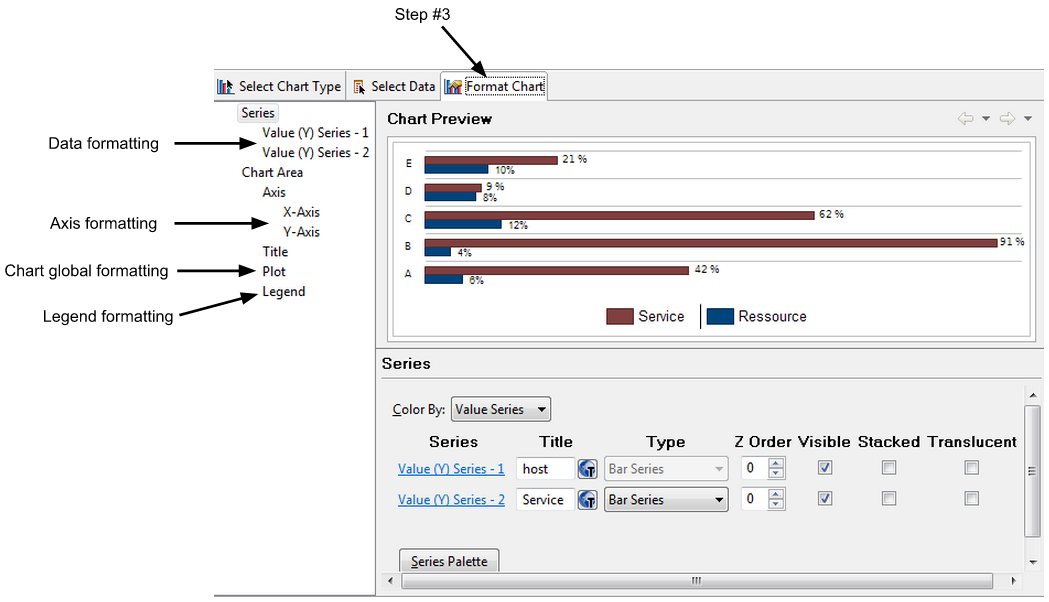
Formatting the chart
BIRT Libraries
A report can contain a large number of components (data sources, data sets, charts, tables). When stored in a shared library, components developed for one report can be used in others.
BIRT libraries (.rptlibrary files) store shared components. Libraries are useful for:
Saving time when developing a report.
Easy maintenance of reports. A bug fix or modification of a component in the library will be applied to every report sharing this component.
A component from a library can be “overloaded” in a report as an override in order to change its appearance or variable parameters.
Operating principle:
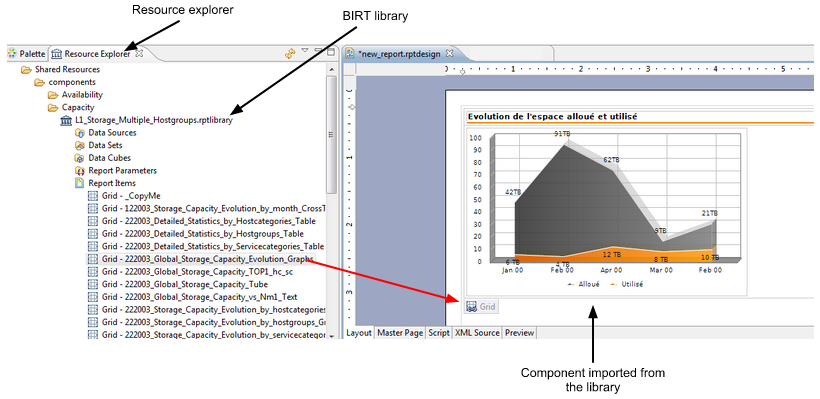
Each report project has a specific folder that stores all the shared resources (e.g., images, BIRT rptlibrary files, CSS files) to be accessed in the report through a relative path.
You can navigate using the “resource explorer” panel in Eclipse BIRT in the resource (rptlibrary) and drag-and-drop the component you need to import into the report.
Each component imported from a library is marked by a specific icon in the report.
BIRT Templates
The report templates (.rpttemplate) serve a different function than the report libraries. The purpose of a report template is to provide a starting point for a new report. A report template can contain the following:
The layout for a new report
Master pages (headers and footers)
Data sources
Data sets
Graphical components
Scripting.
When you start to develop a new report, you can borrow every reusable component from a template. Components can also be imported from BIRT libraries.
A new report has no relationship with the original template whose content has been borrowed. Therefore, any change made to that template cannot affect the reports that use it.