Hostgroups, categories performance analysis by day
Description
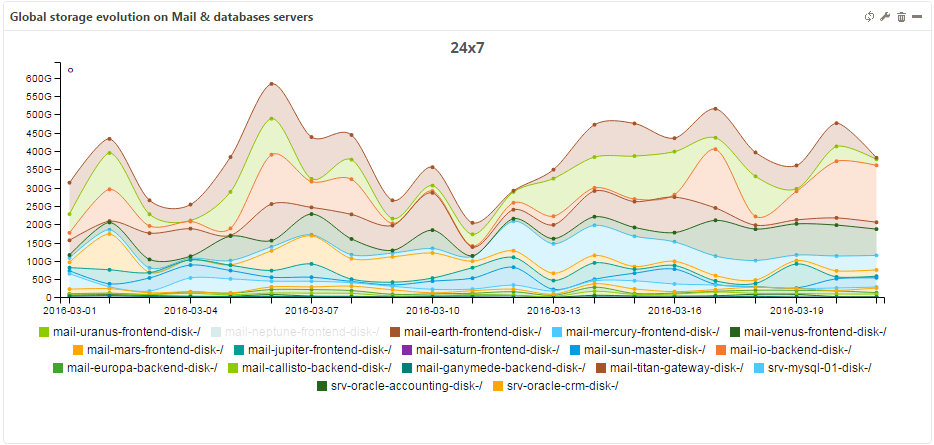
Widget displaying performance data (minimum, average or maximum) by day on a defined periode for groups and categories.
Parameters
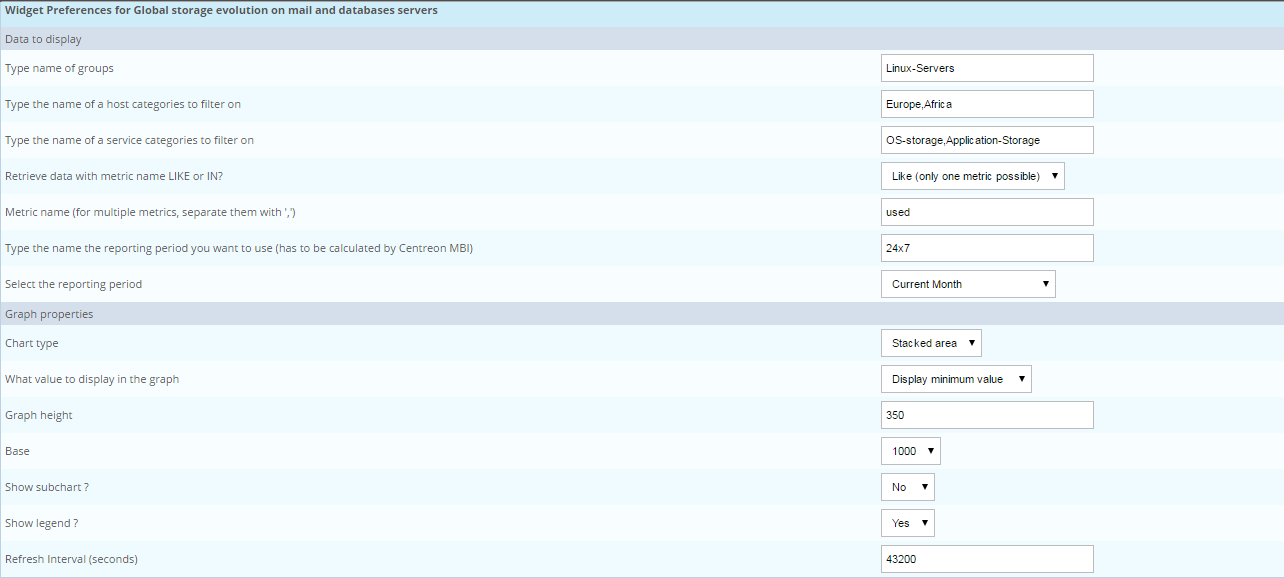
Description
Type name of groups (separate values using ‘,’)
Type the name of a host categories to filter on (separate values using ‘,’)
Type the name of a service categories to filter on (separate values using ‘,’)
Retrieve data with metric name LIKE or IN? : What the method to use to filter on metric name ?
Metric name (for multiple metrics, separate them with ‘,’) : type the name of the metric (if filter mode = like) or multiple metrics (if mode = IN)
Type the name the reporting period you want to use (has to be calculated by Centreon MBI)
Select the reporting period
What value to display in the graph : what type of value to use : minimum, moyenne ou maximum
Graph height : regarding the parameters, the graph might need to be resized. This parameter controls the height of the widget
Base: ce paramètre contrôle les conversion à faire pour afficher les G,M,K etc..
Show subchart ? : Display or hide the subchart
Show legend ? : Display or hide the legend
Refresh Interval (seconds)
Exemple