Report Items
122000_top_datastore_usage
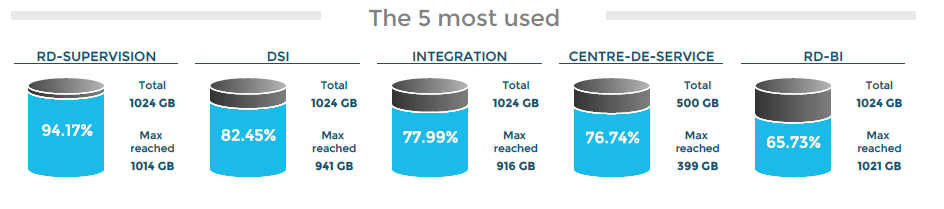
Description: Graph displaying the 5 most used datastores.
|
Report parameters |
122000_bottom_datastore_usage
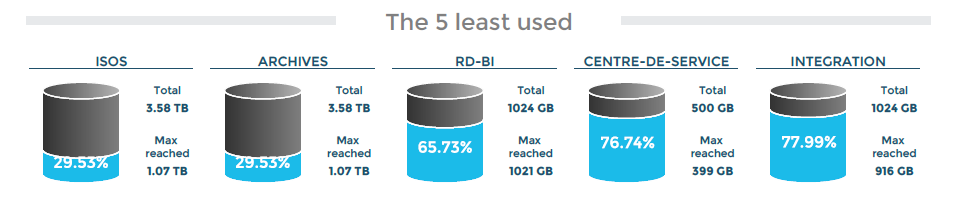
Description: Graph displaying the 5 least used datastores.
|
Report parameters |
122000_global_datastore_usage
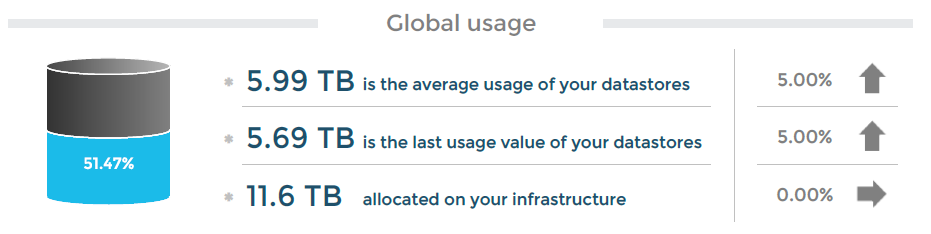
Description: Graph displaying the global usage of cluster’s datastores.
|
Report parameters |
122000_datastore_number
Description: Object displaying the number of datastores available on the cluster.

|
Report parameters |
122000_datastore_iops
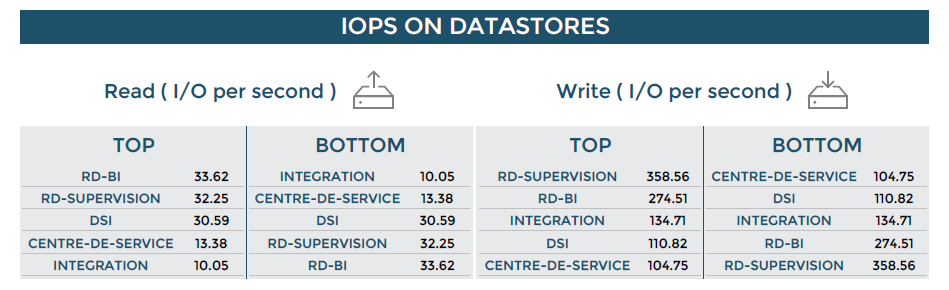
Description: Graph displaying the TOP and the bottom of IOPS on ESXs.
|
Report parameters |
IOPS_servicecategoryID (based on servicecategoryID but renamed) |
|